
Qt Designer 設計概念及與 PyQt 結合的技術(三)
Objective:
- 學習在 GUI 佈局中,加入使用 pyqtgraph 的元件,特別是 GraphicsLayoutWidget
- 學習 pyqtgraph 較特別的繪圖技巧,譬如 multiple-pages(Tab Widget), timer, slide window…
Prerequisite:
- Lesson 1, 2, 3, 4 的觀念與技術。
- 具備製作統計軟體的積極想法。
範例 1: 將 pyqtgraph 的 GraphicsLayoutWidget 鑲嵌於 Qt GUI 裡,以展現分割圖形的功能,如下右圖一。
功能:將 Lesson 1 用於獨立的 pyqtgraph 視窗中的 GraphicsLayoutWidget,透過 Designer 將 Graphics View 提升到(promote to)GraphicsLayoutWidget,並為主程式使用。
注意事項:
前一個單元利用 Designer 的 Widget 元件,將之提升到 pyqtgraph 的 PlotWidget,以便能在 widget 規劃的範圍內繪製 pyqtgraph 的各種圖形。不過,PlotWidget 用以繪製單一圖形,若需要繪製多個圖形(分割圖形區),則使用 GraphicsLayoutWidget。
本範例練習用 Designer 的 Graphics View 元件作為繪圖區,因此必須將之提升到 pyqtgraph 的 GraphicsLayoutWidget,以便能在主程式控制圖形。在 Designer 的提升動作如前一單元,提升後的設定如下圖二。
在 Designer 的設計,將 Graphics View 元件的 objectName 設為 graphLayoutWidget,因此在程式中看到這樣的設定: win = self.graphLayoutWidget。之後便用 win 來生成四張圖。這個 objectName 取這麼長的名稱,只是在提醒自己,這是來自 GraphicsLayoutWidget,沒有其他意思。讀者可以試著改變 objectName,並在程式中修正。
from PyQt6 import QtWidgets, uic
import pyqtgraph as pg
import numpy as np
from scipy.stats import norm
import sys

class MainWindow(QtWidgets.QMainWindow):

    def __init__(self, *args, **kwargs):
        super(MainWindow, self).__init__(*args, **kwargs)

        #Load the UI Page by PyQt6
        uic.loadUi('multiple_Plot_win.ui', self)
        self.setWindowTitle('A Multi-panel Figure')
        win = self.graphLayoutWidget

        self.plt1 = win.addPlot()
        self.plt2 = win.addPlot()

        ## generate normal random numbers
        vals = np.hstack([np.random.normal(size=500), np.random.normal(size=260, loc=4)])

        ## compute standard histogram
        y, x = np.histogram(vals, bins=np.linspace(-3, 8, 40))

        ## Using stepMode="center" causes the plot to draw two lines for each sample.
        ## notice that len(x) == len(y)+1
        self.plt1.plot(x, y, stepMode="center", fillLevel=0, fillOutline=True, brush=(0,0,255,150))

        ## Now draw all points as a nicely-spaced scatter plot
        y = pg.pseudoScatter(vals, spacing=0.15)
        self.plt2.plot(vals, y, pen=None, symbol='o', symbolSize=5, symbolPen=(255,255,255,200), symbolBrush=(0,0,255,150))

        win.nextRow()
        self.plt3 = win.addPlot(title="Parametric, grid enabled")
        self.plt4 = win.addPlot(title="Ellipse")
        x = np.cos(np.linspace(0, 2*np.pi, 1000))
        y = np.sin(np.linspace(0, 4*np.pi, 1000))
        self.plt3.plot(x, y)
        self.plt3.showGrid(x=True, y=True)

        p_ellipse = pg.QtGui.QGraphicsEllipseItem(0, 0, 10, 20)  # x, y, width, height
        p_ellipse.setPen(pg.mkPen((0, 0, 0, 100)))
        p_ellipse.setBrush(pg.mkBrush((50, 50, 200)))
        self.plt4.addItem(p_ellipse)


def main():
    app = QtWidgets.QApplication(sys.argv)
    main = MainWindow()
    main.show()
    sys.exit(app.exec())

if __name__ == '__main__':
    main()


練習: 試著從 Designer 開始設計:拖曳 Graphics View,接著提升到 GraphicsLayoutWidget,最後模仿上述程式,繪製兩列三行的六張分割圖形。
專題:GUI 應用程式常具備多種功能,無法全部擠在單一視窗裡。此時,可以利用折疊式的 tab 功能,類似一般瀏覽器的多個標籤頁功能,讓每一頁呈現不同的應用。如下圖一至圖三屬同一個 GUI,內含的三個 pages(tabs),分別執行「CLT(中央極限定理)」、「Integral(黎曼和積分)」、「Derivative(符號微分計算)」等功能。
功能:
三個 pages, 三個功能,各自獨立。分別設計,各有各的 signals 與 slots,但都放在同一個程式。
圖一是中央極限定理實驗。提供多種 Populations 的選擇,讓使用者輸入樣本數與抽樣次數,依樣本平均數繪製直方圖。為呈現樣本平均數的分配隨著樣本數之不同而逐漸與母體分配間產生差異,甚至逐漸逼近常態分配。
圖二是展現定積分的黎曼和定理。當長方形越細越多時,長方形面積和越接近理論的定積分值。這裡規劃允許使用者自行輸入函數及欲積分的上下限,同時依據長方形的位置可分為三種,最後再加上梯形和。不管採取哪一種規則面積,下方的拉桿用來決定規則面積的數量,數量越大越準確。所有選項的改變,都將立即呈現在圖形上,並計算黎曼和及真實的定積分值。
圖三展現在 GUI 裡運用符號運算的能力。讓使用者自行輸入函數,根據該函數進行一此與二次微分,並將微分後的函數以符號的方式呈現,同時繪圖。
注意事項:
圖四呈現在 Designer 看到的,在 tabWidget 下的三個 pages,各自有 objectName,且之下有其完整的布局元件,同於一般的 GUI 設計。
每個 page 都安排了一個繪圖區,其中 CLT 含兩張圖,因此選擇搭配 GraphicsLayoutWidget,其他兩個可以選 PlotWidget。
積分頁的 f(x)= 讓使用者自行輸入函數。在此最好以 numpy 可以接受的型態輸入,避免再做任何文字處理,譬如,要求使用者輸入: np.sin(x**2)。試想,如果輸入 sin(x**2),程式的處理將有多麻煩?也許得思考使用符號運算的方式(symbolic operation)。
即便輸入 np.sin(x**2),程式該如何處理?因為從 lineEdit 得到的字串與程式內設定的函數不一樣,需要經過 eval() 函數處理。譬如,x = np.linspace(0,1,100), fx = self.lineEdit_int.text(), y = eval(fx),這三個步驟等同於在 python 程式中的,x = np.linspace(0,1,100), y = x**2+3*x+5。 另外,若允許輸入 sin(x**2) 的做法,也可以像這樣:f = eval(“lambda x:”+fx),建立函數。
微分頁(Derivative)直接採用符號運算的方式處理。譬如圖三,可以輸入 exp(sin(x)) 得到一次與二次導函數。符號運算的指令如,x = Symbol(‘x’) , fx = eval(self.lineEdit_fx.text()), fp = diff(fx) 得到一次導函數 fp,fpp = diff(fx, x, 2) 則得到二次導函數。
含多頁的應用程式與單頁的程式差不多,譬如下列的程式碼,一開始便直接執行三個頁面的程式。若要指定開啟時哪一個頁面先呈現出來,指令為:self.tabWidget.setCurrentIndex(0) 表示開啟編號為 0 的頁面。頁面的編號則是在 Designer 設計時,在「屬性編輯器」設定。
本範例的重點僅展示多頁功能的 GUI 該如何布局,讀者可以試著從 Designer 開始,模仿這裡的做法,將前面曾練習過的應用程式搬過來,當作其中的一頁。


class MainWindow(QtWidgets.QMainWindow):

    def __init__(self, *args, **kwargs):
        super(MainWindow, self).__init__(*args, **kwargs)

        #Load the UI Page by PyQt6
        uic.loadUi('PyQtTabPages.ui', self)
        self.tabWidget.setCurrentIndex(0)
        self.setWindowTitle('An application with multiple pages')
        # page 1
        win = self.graphLayout
        self.plt1 = win.addPlot()
        self.plt2 = win.addPlot()
        self.update_plot_clt()
        # page 2
        self.update_plot_int()
        # page 3
        self.der = self.graphicsView_der
        self.update_plot_der()


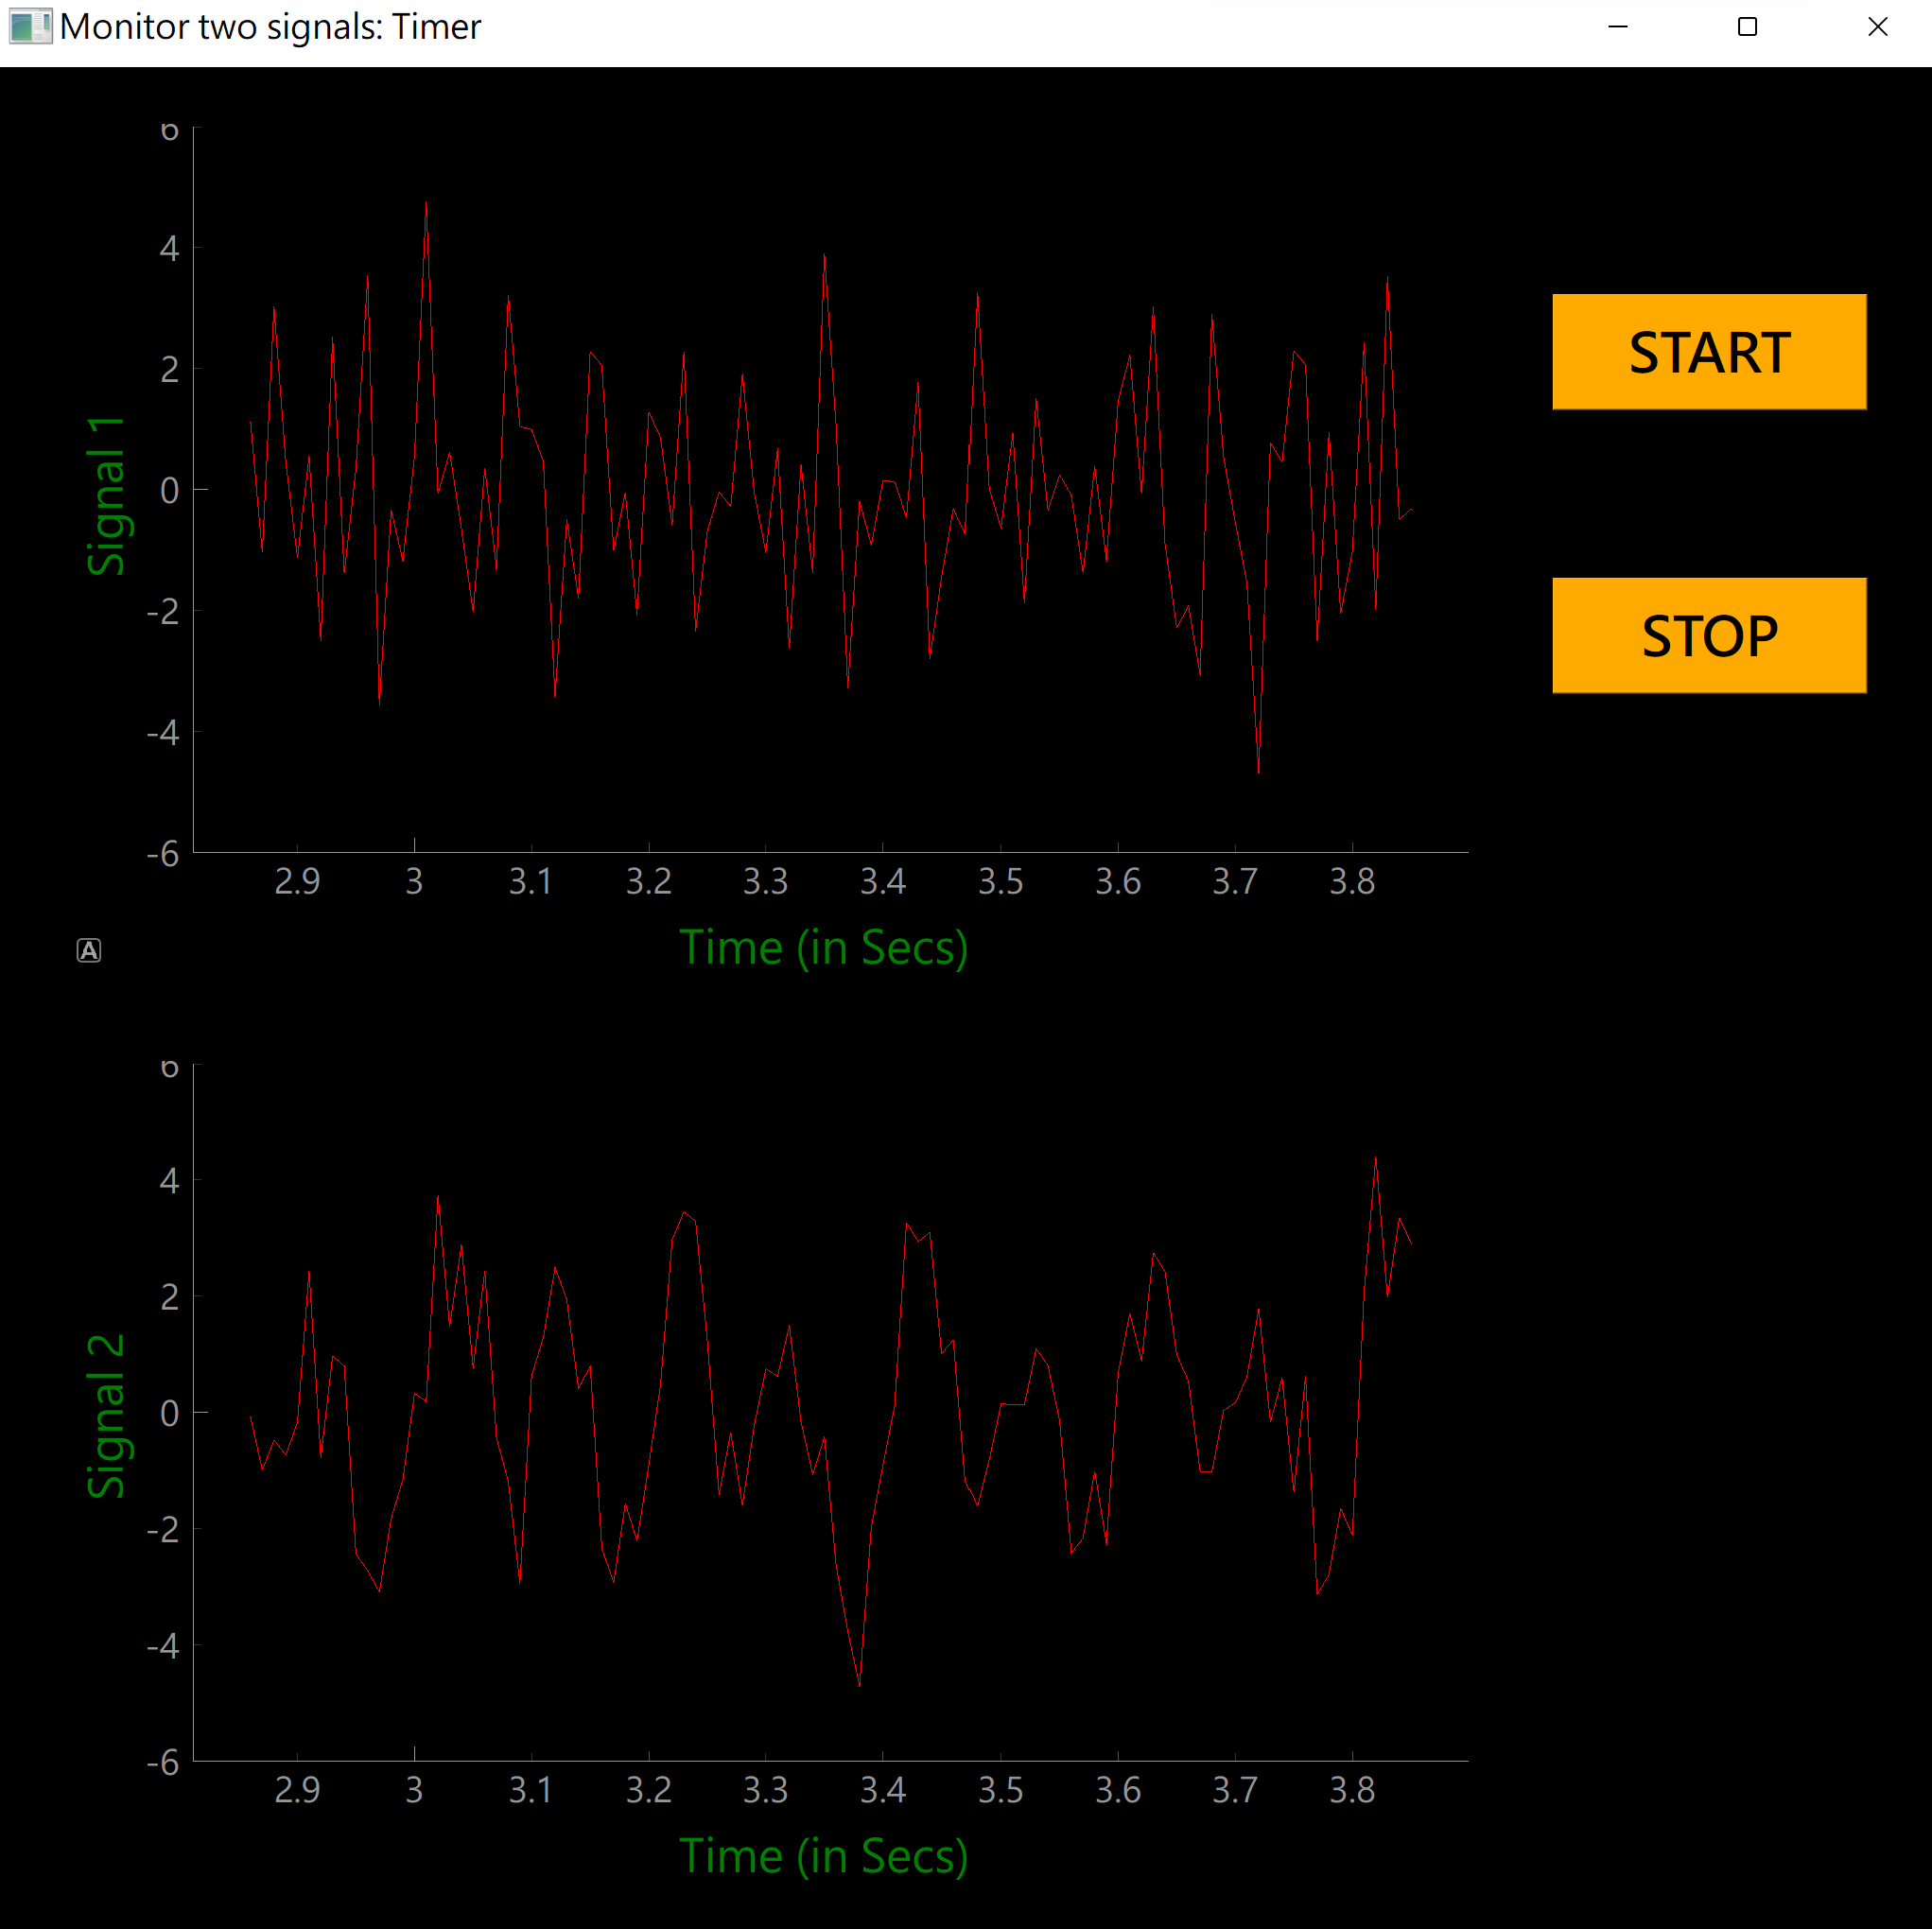
範例 2: 製作具計時器(Timer)功能的應用程式:以模擬訊號監督系統為例,如下圖。
功能:利用計時器功能,模擬即時訊號監督,如圖的兩個訊號來源,訊號隨時間不斷地產生,舊訊號不斷地往左推移。
注意事項:
許多應用程式都具即時性,按設定的時間,定時啟動,用以更新資料或擷取新資料等。pyqtgraph 的定時器功能非常便利,簡單的設定便能順利執行。
本範例模擬兩組訊號依時序動態呈現,並設計兩個按鈕,用來暫停(STOP)與啟動(START)。
本範例刻意設計了兩個 widget 分別提升到 PlotWidget 當作兩個訊號的繪圖區。當然也可以使用一個 Graphics View 提升到 GraphicsLayoutWidget 來分割繪圖區。
本範例重點在 pyqtgraph 的計時器設定與操作。步驟如下:
self.timer = QTimer():開啟計時器
self.timer.setInterval(timeInterval):設定時間 timeInterval,單位為 millisecond,譬如 1000 等於 1 秒。
self.timer.timeout.connect(self.update_plot_data):代表設定時間到了之後的 signal,及啟動的事件(slot)。
製作定時器的 slot 函數,在此為 update_plot_data 函數。在本範例,該函數只做簡單的訊號遞移一格,看起來像訊號源源不斷地進來。利用 setData 更換圖形。
其他如定時器的暫停與重新啟動,則做在兩個按鈕的 signal & slot 裡面。讀者一看便知。
另,下圖也刻意為背景與按鈕塗裝顏色,這個功能可以輕易在 Designer 的「屬性編輯器」的「styleSheet」進行設定,譬如 background-color。 若行有餘力,也可以找到 customized 按鈕,展現商品化的質感。
from PyQt6 import QtWidgets, uic
from PyQt6.QtCore import QTimer
import pyqtgraph as pg
import numpy as np
from scipy.stats import norm
import sys

class MainWindow(QtWidgets.QMainWindow):

    def __init__(self, *args, **kwargs):
        super(MainWindow, self).__init__(*args, **kwargs)

        #Load the UI Page by PyQt6
        uic.loadUi('PyQtGraph_Designer_Qtimer.ui', self)
        self.setWindowTitle('Monitor two signals: Timer')

        # prepare data
        fs = 100;    # sampling frequency (Hz)
        self.x = np.arange(0, 10, 1/fs)
        self.y = 1.3*np.sin(2*np.pi*15*self.x) + \
                1.7*np.sin(2*np.pi*40*(self.x-2)) + \
                norm.rvs(size = len(self.x))
        self.y2 = np.sin(2*np.pi*5*self.x) + \
                2*np.sin(2*np.pi*10*self.x) + \
                norm.rvs(size = len(self.x))
        self.start, self.end = 0, 100

        pen = pg.mkPen(color=(255, 0, 0))
        x_show = self.x[self.start:self.end]
        y_show = self.y[self.start:self.end]
        y2_show = self.y2[self.start:self.end]
        self.data_line =  self.graphWidget.plot(x_show, y_show, pen=pen)
        styles = {'color':'green', 'font-size':'16px'}
        self.graphWidget.setLabel('left', 'Signal 1', **styles)
        self.graphWidget.setLabel('bottom', 'Time (in Secs)', **styles)
        self.graphWidget.setYRange(-6, 6, padding=0)

        self.data_line2 =  self.graphWidget2.plot(x_show, y2_show, pen=pen)
        styles = {'color':'green', 'font-size':'16px'}
        self.graphWidget2.setLabel('left', 'Signal 2', **styles)
        self.graphWidget2.setLabel('bottom', 'Time (in Secs)', **styles)
        self.graphWidget2.setYRange(-6, 6, padding=0)

        self.timer = QTimer()
        timeInterval = 60
        self.timer.setInterval(timeInterval) # milliseconds, i.e, 1 sec = 1000 millisecond
        self.timer.timeout.connect(self.update_plot_data) # emit every timeInterval millisecond
        self.push_stop.clicked.connect(self.stopMoving)
        self.push_start.clicked.connect(self.startMoving)
        self.timer.start()

    def update_plot_data(self):
        self.start += 1
        self.end += 1
        if self.end <= len(self.y):
            # use setData to change the line instead of clearing and redrawing plot.
            self.data_line.setData(self.x[self.start:self.end], self.y[self.start:self.end])  # Update the data.
            self.data_line2.setData(self.x[self.start:self.end], self.y2[self.start:self.end])  # Update the data.
        else:
            self.timer.stop()

    def stopMoving(self):
        self.timer.stop()

    def startMoving(self):
        self.timer.start()


def main():
    app = QtWidgets.QApplication(sys.argv)
    main = MainWindow()
    main.show()
    sys.exit(app.exec())

if __name__ == '__main__':
    main()
練習:想一個具備定時功能的應用程式,練習將定時器的整個設定程序走一遍。
譬如,下圖有六個號碼。設計定時器,每隔 1 秒,隨機產生另一組號碼。當然也可以加入按鈕做其他控制之用。

範例 3: 學習滑鼠(觸控板)對 GUI 的圖形視窗的區域控制能力,如下圖。
功能:如下圖之兩個圖形,在上圖選定一區域(並且可以往前或往後拖曳,拉開左右兩條線還可以放大範圍),讓該區域的資料在下圖的範圍內呈現。也就是放大上圖的一小區域在下圖。除了放大之外,當然也可以做其他處哩,譬如分析或計算該區段的某些統計特性,或做適當的資料轉換,如 FFT 或降低躁音等後處理。
注意事項:
這是目前為止較為複雜的 signal & slot 的處理,但卻是 pyqtgraph 擅長的互動式表現。
本示範程式刻意在 Designer 設計時,選擇用 Widget 提升到 GraphicsLayoutWidget,作為兩個分割視窗的的元件。
pyqtgraph 為滑鼠設計了很多 signal,譬如本範例的拖曳或改變特定區域的 signal。 當特定區域被更動時,將觸動一連串的 signals + slots,光看這一連串的觸動指令,不容易理解到底做了甚麼事?為何需要連串的觸動?想了解每個 signal 為何被觸動?每個 slot 做了甚麼事?可以採 Debug 模式,在每個 signal 與 slot 設定斷點,觀察程式的走向與相關的變數內容。
from PyQt6 import QtWidgets, uic
import pyqtgraph as pg
import numpy as np
import sys

class MainWindow(QtWidgets.QMainWindow):

    def __init__(self, *args, **kwargs):
        super(MainWindow, self).__init__(*args, **kwargs)

        #Load the UI Page by PyQt6
        uic.loadUi('slide_win.ui', self)
        self.setWindowTitle('Sliding window on a graph')

        data_dir = '../Data/'
        self.D = np.loadtxt(data_dir + 'onemin.txt', comments='%')
        # sample = self.D[:,1]

        print(self.dataItem.count())

        win = self.graphLayoutWidget

        self.plt1 = win.addPlot(title="Region Selection")
        win.nextRow()
        self.plt2 = win.addPlot(title="Zoom on selected region")
        #-----------------------------------------
        self.slide_range = [1000, 1400]
        self.lr = pg.LinearRegionItem(values = self.slide_range)
        # self.lr.setZValue(10) # set it large to be on top of other items
        self.selectionChange(0) # call function below to show the first set of data
        #-----------------------------------------
        # Signals
        self.lr.sigRegionChanged.connect(self.updatePlot) # update plot2
        self.plt2.sigXRangeChanged.connect(self.updateRegion) # update plot1
        self.dataItem.currentIndexChanged.connect(self.selectionChange)

        self.updatePlot()

    # Slots:
    def updatePlot(self):
        self.lr.setZValue(10)
        self.plt2.setXRange(*self.lr.getRegion(), padding=0) # * collects all the positional arguments in a tuple.

    def updateRegion(self):
        self.lr.setRegion(self.plt2.getViewBox().viewRange()[0])
        # print(self.plt2.getViewBox().viewRange()[0])

    def selectionChange(self, i):
        self.plt1.setTitle(self.dataItem.currentText())# which data set
        self.plt1.clear()
        self.plt2.clear()
        sample = self.D[:,i+1] # show selected data
        self.plt1.plot(sample)
        self.lr.setRegion(self.slide_range)
        self.plt1.addItem(self.lr)

        pen = pg.mkPen(color=(0, 255, 0))
        self.plt2.plot(sample, pen = pen)


def main():
    app = QtWidgets.QApplication(sys.argv)
    main = MainWindow()
    main.show()
    sys.exit(app.exec())

if __name__ == '__main__':
    main()

練習: 前一個範例利用滑鼠製作 sliding windows 的效果,如果再加上滑鼠的定位資訊,可以完成如下圖的功能(註)。
功能:
將上市公司的公開資訊,如歷年來的每日開盤/收盤價(下載參考檔案, 資料來源:鉅亨網)以時間順序畫出趨勢圖,如圖一、二之下層圖,並利用上個範例的技術框住一個小範圍,同時將該範圍的資料畫在上層。
當滑鼠移到上層圖的任一位置時,將對應到資料中的某一日,此時將該日的日期、開盤與收盤價都以醒目的方式寫在圖上方。
同樣可以擴大或縮小資料的圈選範圍,也可以移動範圍。


範例 4:試用在 GUI 中的表格元件 Table View,如下圖。
功能:依指定的分配、變數數量與樣本數,產生隨機樣本並置入 Table View 元件。並試試幾個功能,譬如,表格中的負數皆以紅色字型表示、偶數行的底色不同。
參考來源:Displaying tabular data in Qt6 ModelViews(更多細節)
注意事項:
GUI 的表格元件 Table View 較之其他元件複雜許多,原因是表格的呈現有許多的細節要兼顧,而 Qt 賦予開發者較多的掌控權,讓表格呈現「多彩多姿」的樣貌。
在 Designer 裡的 Table View 元件的「屬性編輯器」,會看到很豐富的設定條件,初學者可以一一瀏覽、探索,或先接受其預設值,讓資料先呈現出來,再慢慢調整。
使用 Table View 將資料呈現在 GUI 的表格中,需要具備基礎的概念,特別是程式的步驟:
Step 1: 建立一個 QTableView Widget,譬如程式中的 self.table = self.tableView,其中 self.tableView 的 tableView 即在 Designer 設計時,給予 TableView 元件的 objectName。這個名稱當然是自取的。
Step 2: 建立一個「客製化表格模型」class 的 instance。所謂「客製化表格模型」class 是基於 QAbstractTableModel 在程式中建立的 class,而該 class 具備一些客製化條件,譬如表格的顏色、文字或數字的呈現、資料如何在表格中對齊 … 等,有非常多客製化條件供設定。下圖的紅色負值與綠色偶數行,便是透過這個「客製化表格模型」class 設定的,即下列程式碼中的 class TableModel(QtCore.QAbstractTableModel),而建立屬於這個 class 的物件,則是 self.model = TableModel(Data),其中 Data 便是準備呈現的資料。
Step 3: 將帶有資料的客製化表格模型的物件指定給 GUI 的 Table View widget,準備呈現出來。如程式碼中的 self.table.setModel(self.model)。
在「客製化表格模型」class 中,有三個必備的 method,分別是 data, rowCount, columnCount。後兩者只是回復資料的列與行的數量。重頭戲是 def data(self, index, role),其中 index 代表資料的行列索引位置,而 role 則是用來設定資料呈現的方式。下列程式碼示範了四個 role 的設定,包括:
role == Qt.ItemDataRole.DisplayRole;這是關於表格內資料呈現的方式,本程式將所有資料的輸出限制在小數點四位。
role == Qt.ItemDataRole.TextAlignmentRole;這是關於行列對齊的方式,本程式將所有資料以垂直置中與水平置右的方式呈現。
role == Qt.ItemDataRole.BackgroundRole and index.column() % 2 != 0,這是關於背景的細節,本程式將偶數行的底色改為 QtGui.QColor(‘#d8ffdb’)。
role == Qt.ItemDataRole.ForegroundRole,這是關於文字或數字的細節,本程式將負數以紅色呈現。
依照本範例的示範,應可以順利完成可用的表格。不過,本範例的「客製化表格模型」class 只適合資料以矩陣方式存在的,譬如本範例透過 numpy 產生標準常態的樣本,資料為 100 x 4 的矩陣(如圖)。假設資料來自外部,並以 pandas 套件處理的 EXCEL 檔,資料的型態便不是單純的矩陣,下一個範例提供較適當的做法。
請注意,下列程式碼並沒有處理任何 signals,請讀者自行加入。
import sys
from PyQt6 import QtCore, QtGui, QtWidgets, uic
from PyQt6.QtCore import Qt
import numpy as np
from scipy.stats import norm


class TableModel(QtCore.QAbstractTableModel): # custom table model

    def __init__(self, data):
        super(TableModel, self).__init__()
        self._data = data

    def data(self, index, role): # required method
        if role == Qt.ItemDataRole.DisplayRole:
            value = self._data[index.row(), index.column()]
            return str(round(value,4))

        if role == Qt.ItemDataRole.TextAlignmentRole:
            return Qt.AlignmentFlag.AlignVCenter + Qt.AlignmentFlag.AlignRight # vertical + horizontal

        if role == Qt.ItemDataRole.BackgroundRole and index.column() % 2 != 0: # change background color on even column
            return QtGui.QColor('#d8ffdb')

        if role == Qt.ItemDataRole.ForegroundRole:
            value = self._data[index.row()][index.column()]
            if value < 0 :
            # if (
            #     (isinstance(value, int) or isinstance(value, float))
            #     and value < 0
            # ):
                return QtGui.QColor('red') # change color if value < 0


    def rowCount(self, index): # required method
        return self._data.shape[0]

    def columnCount(self, index): # required method
        return self._data.shape[1]

class MainWindow(QtWidgets.QMainWindow):

    def __init__(self):
        super().__init__()
        uic.loadUi('PyQtTable_numpy.ui', self)
        self.setWindowTitle('Table View: the numpy version')

        self.table = self.tableView # setp 1:create a QTableView widget
        # prepare data
        sample = int(self.lineEdit_size.text())
        d = int(self.lineEdit_variables.text())
        Data = norm.rvs(size = (sample, d))

        self.model = TableModel(Data) # step 2:create an instance of custom TableModel object
        self.table.setModel(self.model) # step 3:set Table View with data of TableModel object
        # self.table.resizeColumnsToContents() # adjust column width to textsize


def main():
    app = QtWidgets.QApplication(sys.argv)
    main = MainWindow()
    main.show()
    sys.exit(app.exec())

if __name__ == '__main__':
    main()

範例 5:在 GUI 中讀取 EXCEL 檔案、在表格元件 Table View 中呈現,並根據指定資料繪製直方圖與散佈圖,如圖一所示。
功能:
利用 menubar 製作檔案讀取與應用程式結束的功能。
利用 pandas 套件讀取 EXCEL 檔並呈現在 GUI 的 Table View widget。
根據讀取的 EXCEL 檔案的標題(Column Header),將標題寫至 comboBox 當作 Item。
選擇 comboBox 中的選項(代表表格的欄位)繪製相關圖形,如直方圖與散佈圖。
參考來源:Displaying tabular data in Qt6 ModelViews(更多細節)
注意事項:
這個範例非常精彩,包含幾個製作 GUI 應用程式的技術,如:
從 menubar 讀取檔案的技術。非常實用,而且簡單。
利用 pandas 厲害的能力,將資料標題輕鬆置入表格與 comboBox 元件。
關於 GUI 表格的建立程序與前範例一樣。不同之處,除了資料來源不同,另一個是「客製化表格模型」class 有兩個地方不同:一、對資料矩陣的索引方式不同。由於 pandas 讀進資料後,變成 pandas 物件,在處理上有別於一般資料矩陣。譬如 value = self._data.iloc[index.row(), index.column()],iloc[] 便是 pandas 特有的。二、增加一個處理欄與列標題的 method, 即 def headerData(self, section, orientation, role)。pandas 對於 EXCEL 的標題處理的很輕鬆。
圖一右邊的直方圖採 BarGraphItem 的方式繪製,請參考下列程式碼。
其餘部分,應該不難解讀,或說 python 的程式碼擅長自我表達(self-contained)。不過請注意,下列程式碼並沒有處理 comboBox 的選項 signal,請讀者自行加入,即當使用者選擇某個資料欄位時,必須在圖形上做出反應。圖一內的第二張圖選擇散佈圖,並不是好的選擇(需要兩個變數資料),請另擇其他圖形(譬如 ECDF 圖)。
mport sys
from PyQt6 import QtCore, QtGui, QtWidgets, uic
from PyQt6.QtCore import Qt
import pyqtgraph as pg
import pandas as pd
import numpy as np
from pathlib import Path


class TableModel(QtCore.QAbstractTableModel):

    def __init__(self, data):
        super(TableModel, self).__init__()
        self._data = data

    def data(self, index, role):
        if role == Qt.ItemDataRole.DisplayRole:
            value = self._data.iloc[index.row(), index.column()] #pandas's iloc method
            return str(value)

        if role == Qt.ItemDataRole.TextAlignmentRole:
            return Qt.AlignmentFlag.AlignVCenter + Qt.AlignmentFlag.AlignHCenter

        if role == Qt.ItemDataRole.BackgroundRole and (index.row()%2 == 0):
            return QtGui.QColor('#d8ffdb')

    def rowCount(self, index):
        return self._data.shape[0]

    def columnCount(self, index):
        return self._data.shape[1]

    # Add Row and Column header
    def headerData(self, section, orientation, role):
        # section is the index of the column/row.
        if role == Qt.ItemDataRole.DisplayRole: # more roles
            if orientation == Qt.Orientation.Horizontal:
                return str(self._data.columns[section])

            if orientation == Qt.Orientation.Vertical:
                return str(self._data.index[section])

class MainWindow(QtWidgets.QMainWindow):

    def __init__(self):
        super().__init__()

        uic.loadUi('PyQtTable_pandas.ui', self)
        self.setWindowTitle('Table View: the pandas version')

        self.table = self.tableView

        win = self.graphLayoutWidget

        self.plt1 = win.addPlot(title="")
        win.nextRow()
        self.plt2 = win.addPlot(title="")

        #Signals
        self.actionExit.triggered.connect(self.fileExit)
        self.actionOpen.triggered.connect(self.fileOpen)

    # Slots:
    def fileExit(self):
        self.close()

    def fileOpen(self):
        home_dir = str(Path.home())
        fname = QtWidgets.QFileDialog.getOpenFileName(self, 'Open file',
            "", "EXCEL files (*.xlsx *.xls);;Text files (*.txt);;Images (*.png *.xpm *.jpg)")
        # print(fname[0])
        if fname[0]:
            self.df = pd.read_excel(fname[0], index_col = None, header = 0)
            self.model = TableModel(self.df)
            self.table.setModel(self.model)

            self.label_variable.setText(str(self.df.shape[1]))
            self.label_size.setText(str(self.df.shape[0]))
            self.comboBox_col.clear()
            self.comboBox_col.addItems(self.df.columns)

            self.update_plt1()
            self.update_plt2()

    def update_plt1(self):
        self.plt1.clear()
        y, x = np.histogram(self.df[self.df.columns[0]])
        # self.plt1.plot(x, y, stepMode="center", fillLevel=0, fillOutline=True, brush=(0,0,255,150))
        barItem = pg.BarGraphItem(x = x[0:len(y)-1], height = y, width = (x.max()-x.min())/len(x), brush=(107,200,224))
        self.plt1.addItem(barItem)
        self.plt1.setTitle(self.df.columns[0])

    def update_plt2(self):
        self.plt2.clear()
        if isinstance(self.df[self.df.columns[0]][0], str) or isinstance(self.df[self.df.columns[1]][0], str) :
            self.plt2.setLabel('bottom',"")
            self.plt2.setLabel('left',"")
            return
        else :
        # if self.df[self.df.columns[0]][0]== float and self.df[self.df.columns[1]][0]== float :
            self.plt2.plot(self.df[self.df.columns[0]], self.df[self.df.columns[1]], pen=None, symbol='o', symbolSize=5)
            self.plt2.setLabel('bottom',self.df.columns[0])
            self.plt2.setLabel('left',self.df.columns[1])

def main():
    app = QtWidgets.QApplication(sys.argv)
    main = MainWindow()
    main.show()
    sys.exit(app.exec())

if __name__ == '__main__':
    main()


練習:補足與延伸前一個範例的功能。
為前一個範例的「選擇欄位」加入 signal 與對應的 slot,繪製所選欄位的直方圖。
新增兩個含欄位名稱的 comboBox,做為繪製第二張散佈圖的依據。
準備其他 EXCEL 檔案,測試應用程式的是否應付得宜。有任何錯誤或不妥,則直接修正。若想到更好的補強功能,也可以嘗試加進去。
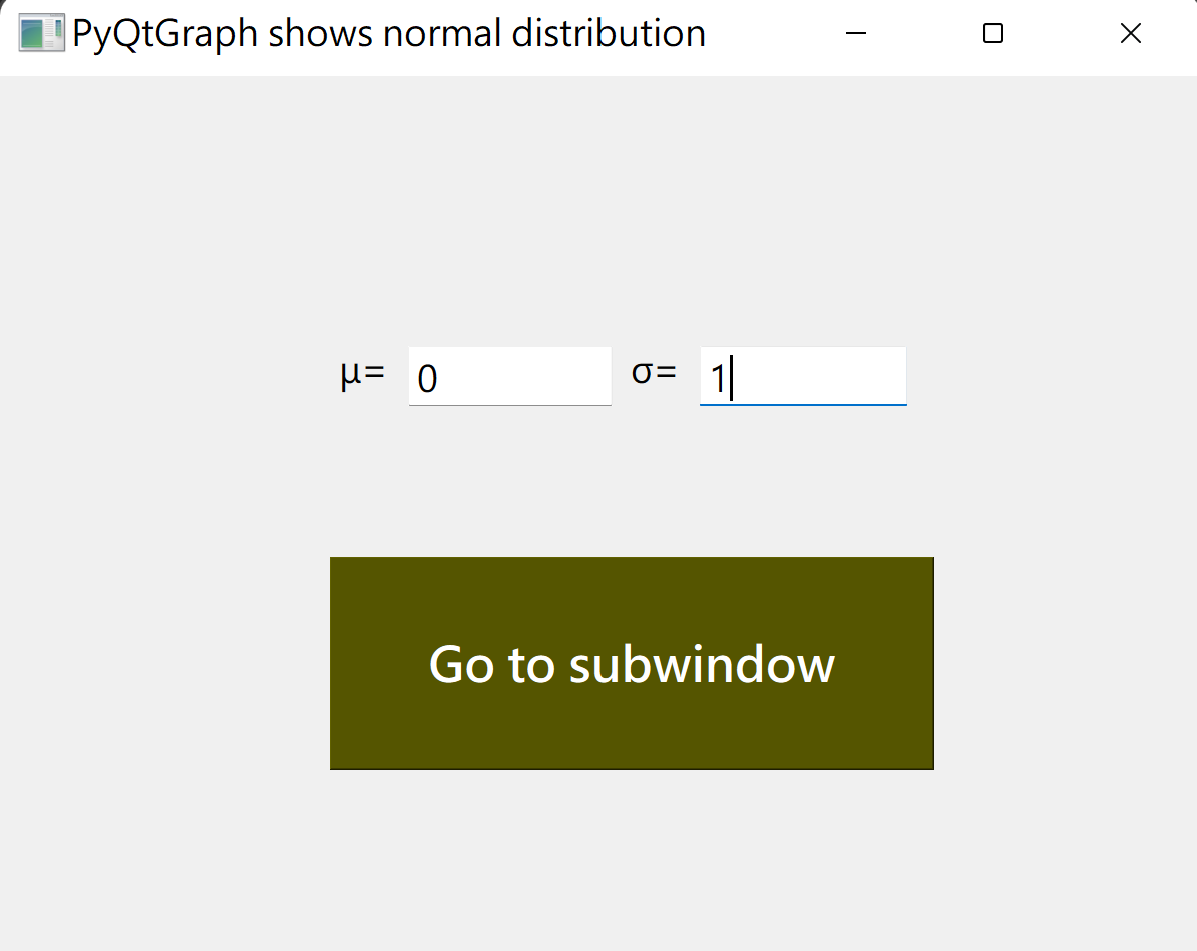
範例 6:利用 TabWidget 做多重視窗的表現。當應用程式所需要的空間無法擠在一個頁面時,往往需要開啟第二個視窗,稱為附屬視窗。在技術上,兩個視窗之間的溝通(資料往來)比較複雜,此時利用 tabWidget 的多重頁面之間的轉換,也可以達到空間利用的目的。下圖一與圖二展示一個簡單的視窗間溝通功能,主視窗設定為第一個頁面,按下按鈕後,將繪圖的任務交給圖二的第二個頁面。因為還在同一個應用程式內,因此繪圖參數的設定雖在第一頁,但在第二頁繪圖時,仍輕鬆取得。
功能:
在多重頁面(tabWidget)的頁面之間轉換。如在圖一按下按鈕即刻繪圖並切換到圖二的頁面。
在圖二的頁面按下「Return to Main tab」 按鈕,即刻切回去主頁面。
練習在不同頁面之間的資料傳輸。
from PyQt6 import QtWidgets, uic
import numpy as np
from scipy.stats import norm
import sys

class MainWindow(QtWidgets.QMainWindow):

    def __init__(self, *args, **kwargs):
        super(MainWindow, self).__init__(*args, **kwargs)

        uic.loadUi('PyQtDesigner_switch_between_pages.ui', self)
        self.tabWidget.setCurrentIndex(0) # force the first tab to appear first
        self.setWindowTitle('Switch between pages')

        # Signal
        self.pBut_show.clicked.connect(self.sub_plot)
        self.pBut_main.clicked.connect(self.to_main)

    #Slots:
    def sub_plot(self):
        self.graphicsView.clear()
        mu = float(self.lineEdit_mu.text())
        s = float(self.lineEdit_sigma.text())
        x = np.linspace(mu-5*s, mu+5*s, 1000)
        y = norm.pdf(x, mu, s)
        self.graphicsView.plot(x, y)
        self.tabWidget.setCurrentIndex(1)

    def to_main(self):
        self.tabWidget.setCurrentIndex(0)

def main():
    app = QtWidgets.QApplication(sys.argv)
    main = MainWindow()
    main.show()
    sys.exit(app.exec())

if __name__ == '__main__':
    main()


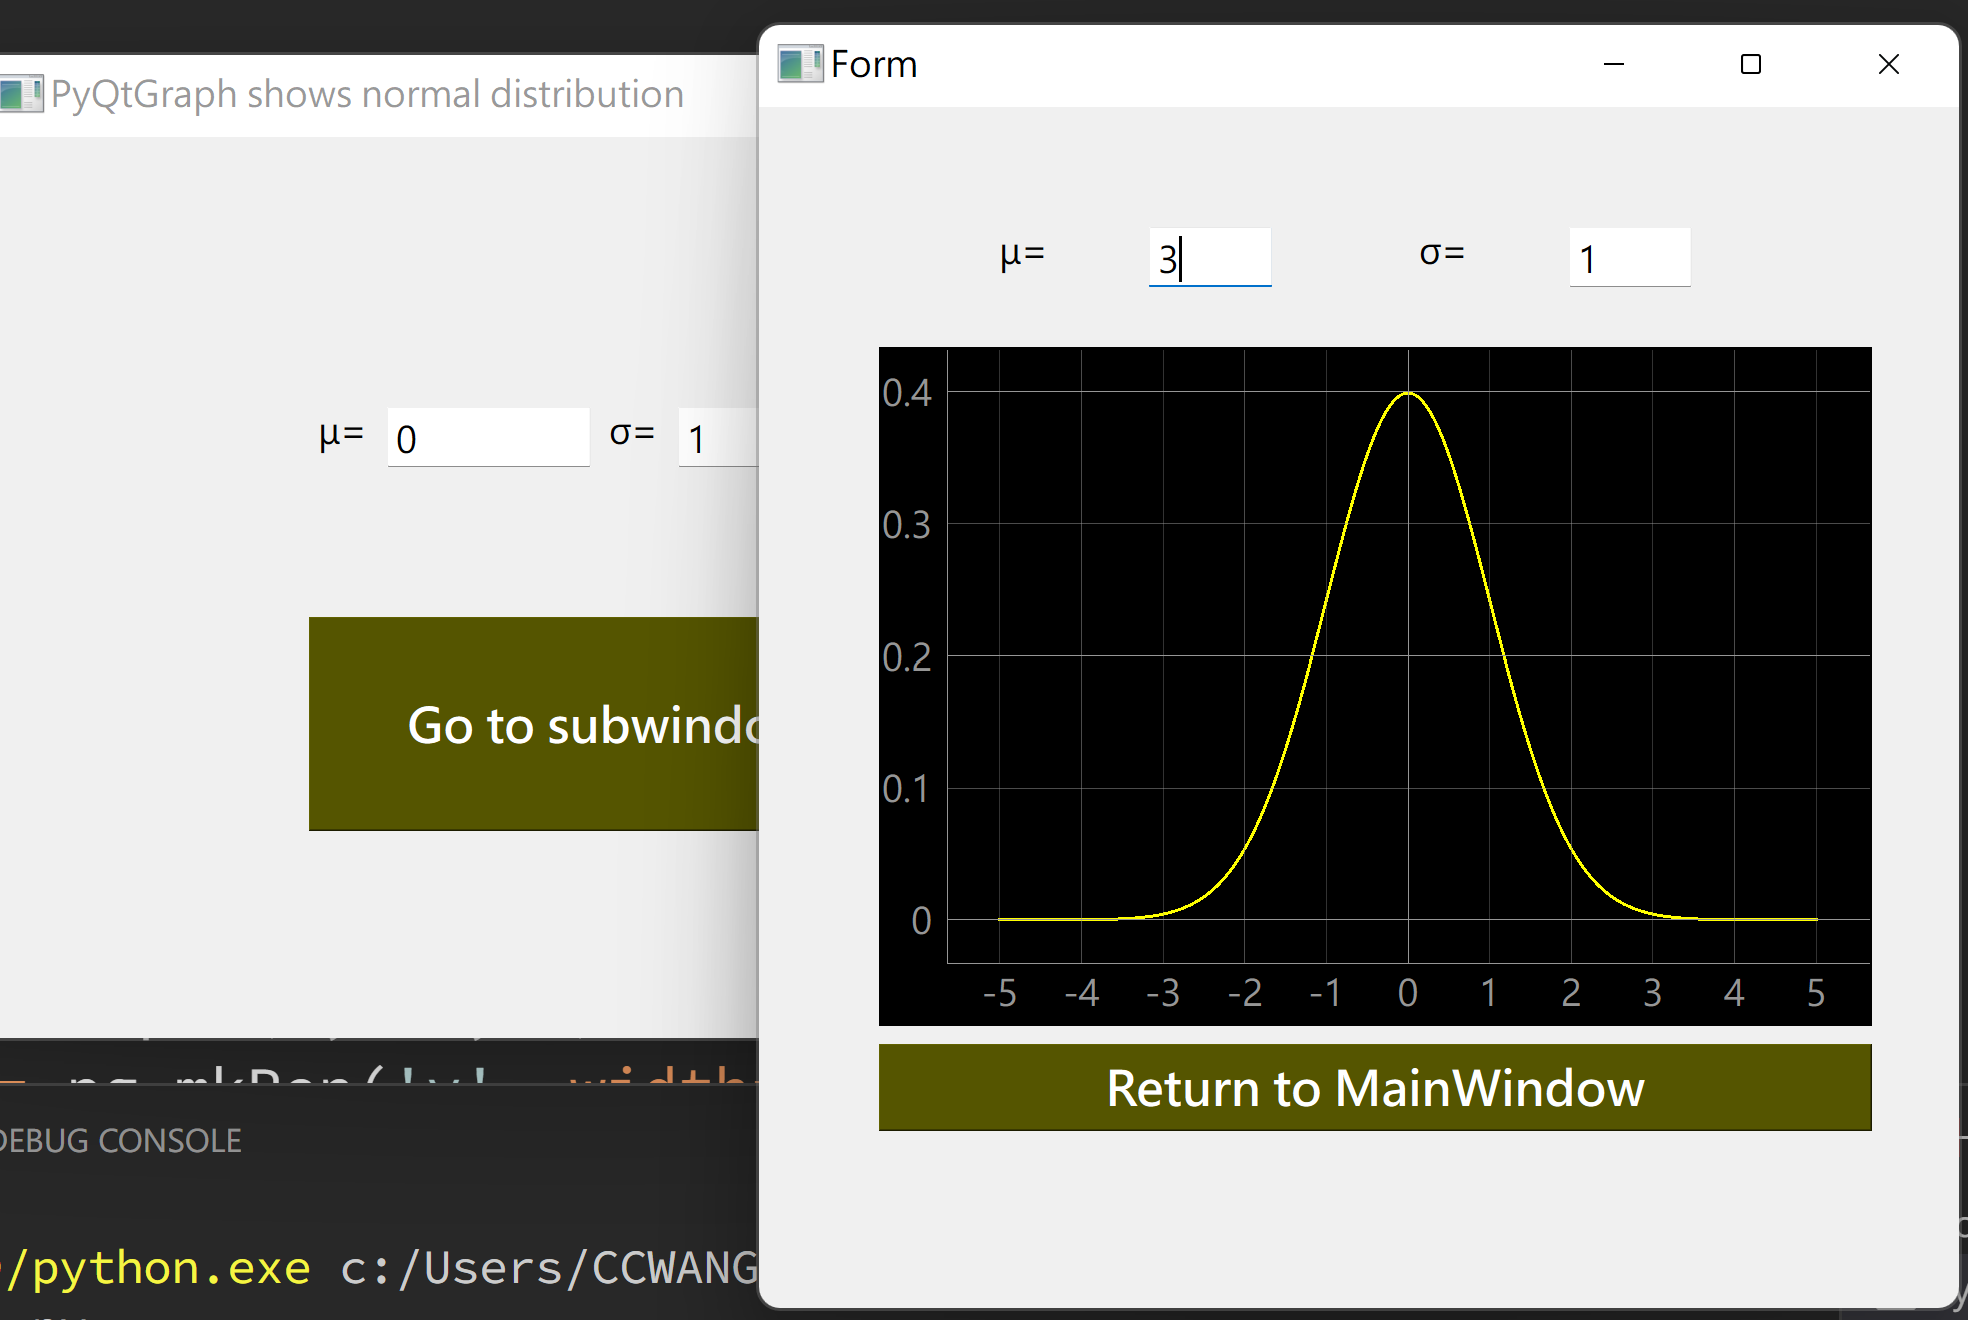
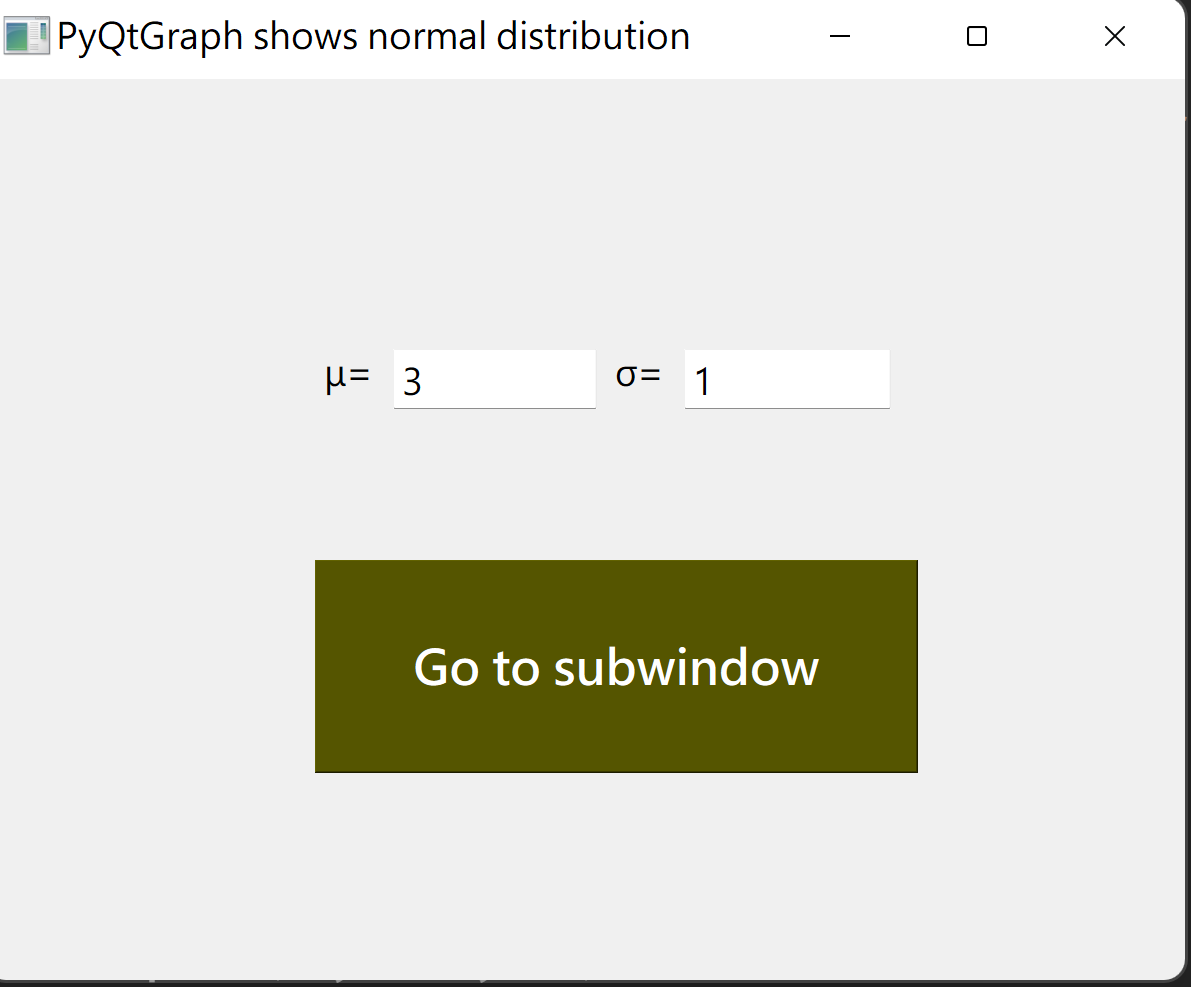
範例 7:主從視窗的開啟與資料傳遞。
功能:
由主視窗開啟副視窗並傳遞資料過去(mu 與 sigma),如圖一。
在副視窗接收來自主視窗的資料並執行任務(繪製常態分配的 PDF 圖),如圖二
允許在副視窗輸入資料(譬如修改 mu 值),在關閉副視窗的同時,將資料傳回給主視窗並變更主視窗上的 mu 值,如圖三。
注意事項:
不像前一個範例利用 tabWidget 的頁與頁間的轉換,以挪出額外的空間呈現單一目的的結果。本範例採用主從視窗的模式。所謂主從視窗,有一個特點,即副視窗開啟時,不能再切換回主視窗,直到副視窗關閉才釋放控制權,否則會形成主從之間的矛盾。一般而言,副視窗都是執行較小型且單一目的的工作,譬如查看額外的資訊(主視窗的空間不足容納),或畫一張圖、產生一個表格等。為了設定副視窗開啟時,不能切回主視窗,必須對副視窗進行設定,譬如在 ui 設計時,將最高層次的視窗的 windowModality 改為 ApplicationModel。當然也可以在程式裡設定。譬如,self.Form.setWindowModality(Qt.ApplicationModal)。
主從視窗或多重視窗的開啟與資料的來回傳遞比較麻煩、曲折些。主要有幾項安排:
主視窗與副視窗擁有獨立的 ui 檔,但是只需要一個 py 程式檔。
在 py 程式裡,除了 MainWindow 的 class 之外,還要多一個負責副視窗的 class,在下列程式碼取名為 class AnotherWindow(QWidget)。
副視窗的開啟通常在主視窗的某個 slot 函數,譬如圖一按鈕的 slot 函數 def call_subWin(self)。在此設定了一個副視窗的物件(instance)、呼叫了副視窗裡面的函數並傳遞了主視窗上的兩個值、建立一個準備回應副視窗回傳值的 signal、最後才 show 出副視窗。至此,副視窗已經開啟並繪製好圖形,如圖二。
圖二準備了一個按鈕提醒使用者回到主視窗,這個動作主要是關閉副視窗,讓主視窗重回主控權。為了展示副視窗也可以回傳資料到主視窗,譬如將圖二上的 mu 值改為 3,關閉後,如圖三主視窗的 mu 值。
按下圖二的按鈕會啟動按鈕的 signal 並連接到 slot 函數,如 def on_submit(self):,這裡就是關閉視窗的地方 self.close()。而在關閉自己的視窗以前,為了傳遞資料到主視窗,必須發射一個自製的 signal,針對名為 submitted 的虛擬物件。這個虛擬物件設定在副視窗類別的第一行 submitted = QtCore.pyqtSignal(str)。對這個虛擬物件發射 emit 的訊號,還夾帶一個參數。並且會被主程式的 slot 函數 def update_info(self, mu): 接收到。
以上細節不易解說,希望讀者細細研究,並嘗試加入 sigma 值,做為另一個傳遞值。也就是。此時自製的訊號器必須改為 submitted = QtCore.pyqtSignal(str, str),其他相關的函數依此原則修改。
from PyQt6 import QtWidgets, QtCore, uic
from PyQt6.QtWidgets import QWidget
from scipy.stats import norm
import pyqtgraph as pg
import numpy as np
import sys

class AnotherWindow(QWidget):
    # create a customized signal
    submitted = QtCore.pyqtSignal(str) # "submitted" is like a component name

    """
    This "window" is a QWidget. If it has no parent, it
    will appear as a free-floating window as we want.
    """
    def __init__(self):
        super().__init__()
        uic.loadUi('PyQtGraph_Designer_MultipleWin_sub.ui', self)
        self.setGeometry(600, 200, 400, 400)

        # Signal
        self.pBut_to_main.clicked.connect(self.on_submit)

    def passInfo(self, mu, s):
        self.lineEdit_sub_mu.setText(mu)
        self.lineEdit_sub_sigma.setText(s)
        mu = float(mu)
        s = float(s)
        self.graphicsView.clear()

        x = np.linspace(mu-5*s, mu+5*s, 1000)
        y = norm.pdf(x, mu, s)
        pen1 = pg.mkPen('y', width=3)
        self.graphicsView.plot(x, y, pen = pen1)
        self.graphicsView.showGrid(x=True, y=True, alpha = 1)

    def on_submit(self):
        # emit a signal and pass data along
        self.submitted.emit(self.lineEdit_sub_mu.text())
        self.close()

class MainWindow(QtWidgets.QMainWindow):

    def __init__(self, *args, **kwargs):
        super(MainWindow, self).__init__(*args, **kwargs)

        uic.loadUi('PyQtGraph_Designer_MultipleWin_main.ui', self)
        self.setWindowTitle('PyQtGraph shows normal distribution')

        # Signals
        self.pBut_graph.clicked.connect(self.call_subWin)

    # Slots
    def call_subWin(self):
        # create a sub-window
        self.anotherwindow = AnotherWindow()
        # pass information to sub-window
        self.anotherwindow.passInfo(self.lineEdit_mu.text(), self.lineEdit_s.text())
        # ready to accept a singal from sub-window
        self.anotherwindow.submitted.connect(self.update_info)
        self.anotherwindow.show()

    @QtCore.pyqtSlot(str) # respond to a signal emitted by the sub-window
    def update_info(self, mu):
        self.lineEdit_mu.setText(mu)

def main():
    app = QtWidgets.QApplication(sys.argv)
    main = MainWindow()
    main.show()
    sys.exit(app.exec())

if __name__ == '__main__':
    main()
範例 8:利用可編輯式表格製作統計軟體:「獨立性檢定」(與「多項比例相同檢定」),如圖一。
功能:
表格可供編輯,即輸入數字、增/刪直欄或橫列資料,如圖二加入一欄與一列。
進行獨立性檢定並輸出相關統計量,如圖三,共五列四欄的資料,程式在進行獨立性檢定時,會加入總數 Total 的一欄與一列。統計量則是根據 Scipy.stats.chi2_contingency 的輸出,共四種。包括卡方統計量、p 值、自由度及期望人數( expected frequency)。
注意事項:
這個 app 動用到對 pandas 的 dataframe 的操作,譬如新增/刪減一欄資料、新增/刪減一列資料。當使用者在表格上修改資料時,dataframe 也會同步更新。
在新增欄或列名稱的 lineEdit 元件,先以 lineEdit 的 setPlaceholderText(“輸入欄位名稱”) 作為提醒之用,使用者可以直接輸入。這個做法可以省去在 lineEdit 前面加一個提示 label,節省空間。當使用者雙擊時,原來輸入的文字立刻消失,方便使用者輸入文字,這裡利用了一個簡單的副程式。
「多項比例相等檢定」與「獨立性檢定」的計算方式相同,因此呼叫同一個函數。
將計算結果回寫到畫面上,是做計算常見的處理,必須非常熟練。
# 獨立性檢定
# 可編輯的表格
# pandas dataframe 的操作

from scipy.stats import chi2_contingency
from PyQt6.QtCore import QAbstractTableModel, Qt
from PyQt6.QtWidgets import QApplication, QMainWindow
from PyQt6 import uic
import pandas as pd
import numpy as np
import sys

class PandasModel(QAbstractTableModel):
    def __init__(self, data):
        super().__init__()
        self._data = data

    def rowCount(self, index):
        return self._data.shape[0]

    def columnCount(self, parnet=None):
        return self._data.shape[1]

    def data(self, index, role=Qt.ItemDataRole.DisplayRole):
        if index.isValid():
            if role == Qt.ItemDataRole.DisplayRole or role == Qt.ItemDataRole.EditRole:
                value = self._data.iloc[index.row(), index.column()]
                return str(value)
        if role == Qt.ItemDataRole.TextAlignmentRole:
            return Qt.AlignmentFlag.AlignVCenter + Qt.AlignmentFlag.AlignHCenter
            # return Qt.AlignmentFlag.AlignVCenter + Qt.AlignmentFlag.AlignLeft

    def setData(self, index, value, role):
        if role == Qt.ItemDataRole.EditRole:
            self._data.iloc[index.row(), index.column()] = value
            return True
        return False

    # def headerData(self, col, orientation, role):
    #     if orientation == Qt.Orientation.Horizontal and role == Qt.ItemDataRole.DisplayRole:
    #         return self._data.columns[col]

    def headerData(self, section, orientation, role):
        # section is the index of the column/row.
        if role == Qt.ItemDataRole.DisplayRole: # more roles
            if orientation == Qt.Orientation.Horizontal:
                return str(self._data.columns[section])

            if orientation == Qt.Orientation.Vertical:
                return str(self._data.index[section])

    def flags(self, index):
        return Qt.ItemFlag.ItemIsSelectable | Qt.ItemFlag.ItemIsEnabled | Qt.ItemFlag.ItemIsEditable


class MainWindow(QMainWindow):
    def __init__(self):
        super().__init__()
        uic.loadUi('PyQtTable_Designer_Editable.ui', self)
        self.lineEdit_newColumn.setPlaceholderText('輸入新欄名稱')
        self.lineEdit_newRow.setPlaceholderText('輸入新列名稱')

        self.df = pd.DataFrame(
            [[1, 9, 2], [1, 2, 4], [3, 5, 2], [3, 3, 2], [5, 8, 9],], \
                columns=["Column 1", "Column 2", "Column 3"], \
                    index = ["Row 1", "Row 2", "Row 3", "Row 4", "Row 5"]
        )

        self.model = PandasModel(self.df)
        self.tableView.setModel(self.model)
        # add column and row items to comboBox
        self.comboBox_colDelete.addItems(self.df.columns)
        self.comboBox_rowDelete.addItems(self.df.index)

        # Signals
        self.pBut_indeptest.clicked.connect(self.chi2test)
        self.pBut_proptest.clicked.connect(self.chi2test)
        self.pBut_addColumn.clicked.connect(self.addColumn)
        self.pBut_addRow.clicked.connect(self.addRow)
        self.pBut_colDelete.clicked.connect(self.deleteColumn)
        self.pBut_rowDelete.clicked.connect(self.deleteRow)
        self.lineEdit_newColumn.selectionChanged.connect(self.clear_newColumn)
        self.lineEdit_newRow.selectionChanged.connect(self.clear_newRow)

    # Slots
    def chi2test(self):
        D = self.df.values.astype(int) # get array data from pandas
        total_col = np.append(np.sum(D, axis = 0), np.sum(D))
        total_row = np.sum(D, axis = 1)
        self.df['Total']= total_row
        self.df.loc['Total']= total_col
        self.model = PandasModel(self.df)
        self.tableView.setModel(self.model)
        self.comboBox_colDelete.clear()
        self.comboBox_colDelete.addItems(self.df.columns)
        self.comboBox_rowDelete.clear()
        self.comboBox_rowDelete.addItems(self.df.index)
        chi2, p, dof, expected = chi2_contingency(D)
        report_result = 'Chi2 statistic = ' + str(np.round(chi2,4)) + '\n'
        report_result = report_result + 'p-value = ' + str(np.round(p,4)) + '\n'
        report_result = report_result + 'DOF = ' + str(dof) + '\n'
        report_result = report_result + 'Expected Frequency = ' + '\n'+ str(np.round(expected, 2))
        self.textBrowser_results.setText(report_result)
        print([chi2, p, dof, expected])


    def addColumn(self):
        col_name = self.lineEdit_newColumn.text()
        self.df[col_name]= 0
        self.model = PandasModel(self.df)
        self.tableView.setModel(self.model)
        self.comboBox_colDelete.clear()
        self.comboBox_colDelete.addItems(self.df.columns)

    def addRow(self):
        row_name = self.lineEdit_newRow.text()
        self.df.loc[row_name] = 0
        self.model = PandasModel(self.df)
        self.tableView.setModel(self.model)
        self.comboBox_rowDelete.clear()
        self.comboBox_rowDelete.addItems(self.df.index)

    def deleteColumn(self):
        col = self.comboBox_colDelete.currentText()
        del self.df[col] # self.df.drop([col], axis = 1)
        self.model = PandasModel(self.df)
        self.tableView.setModel(self.model)
        self.comboBox_colDelete.clear()
        self.comboBox_colDelete.addItems(self.df.columns)


    def deleteRow(self):
        row = self.comboBox_rowDelete.currentText()
        self.df = self.df.drop(row)
        self.model = PandasModel(self.df)
        self.tableView.setModel(self.model)
        self.comboBox_rowDelete.clear()
        self.comboBox_rowDelete.addItems(self.df.index)

    def clear_newColumn(self):
        self.lineEdit_newColumn.clear()

    def clear_newRow(self):
        self.lineEdit_newRow.clear()

app = QApplication(sys.argv)
window = MainWindow()
window.show()
app.exec()


