Qt Designer 設計概念及與 PyQt 結合的技術(二)
Objective:
- 學習在 GUI 佈局中,加入使用 pyqtgraph 的元件。
- 學習更多 pyqtgraph 的繪圖技巧。
- 學習更多元件的使用。
Prerequisite:
- Lesson 1, 2, 3 的觀念與技術。
- 具備統計學的觀念,才能做出適切的統計應用軟體。
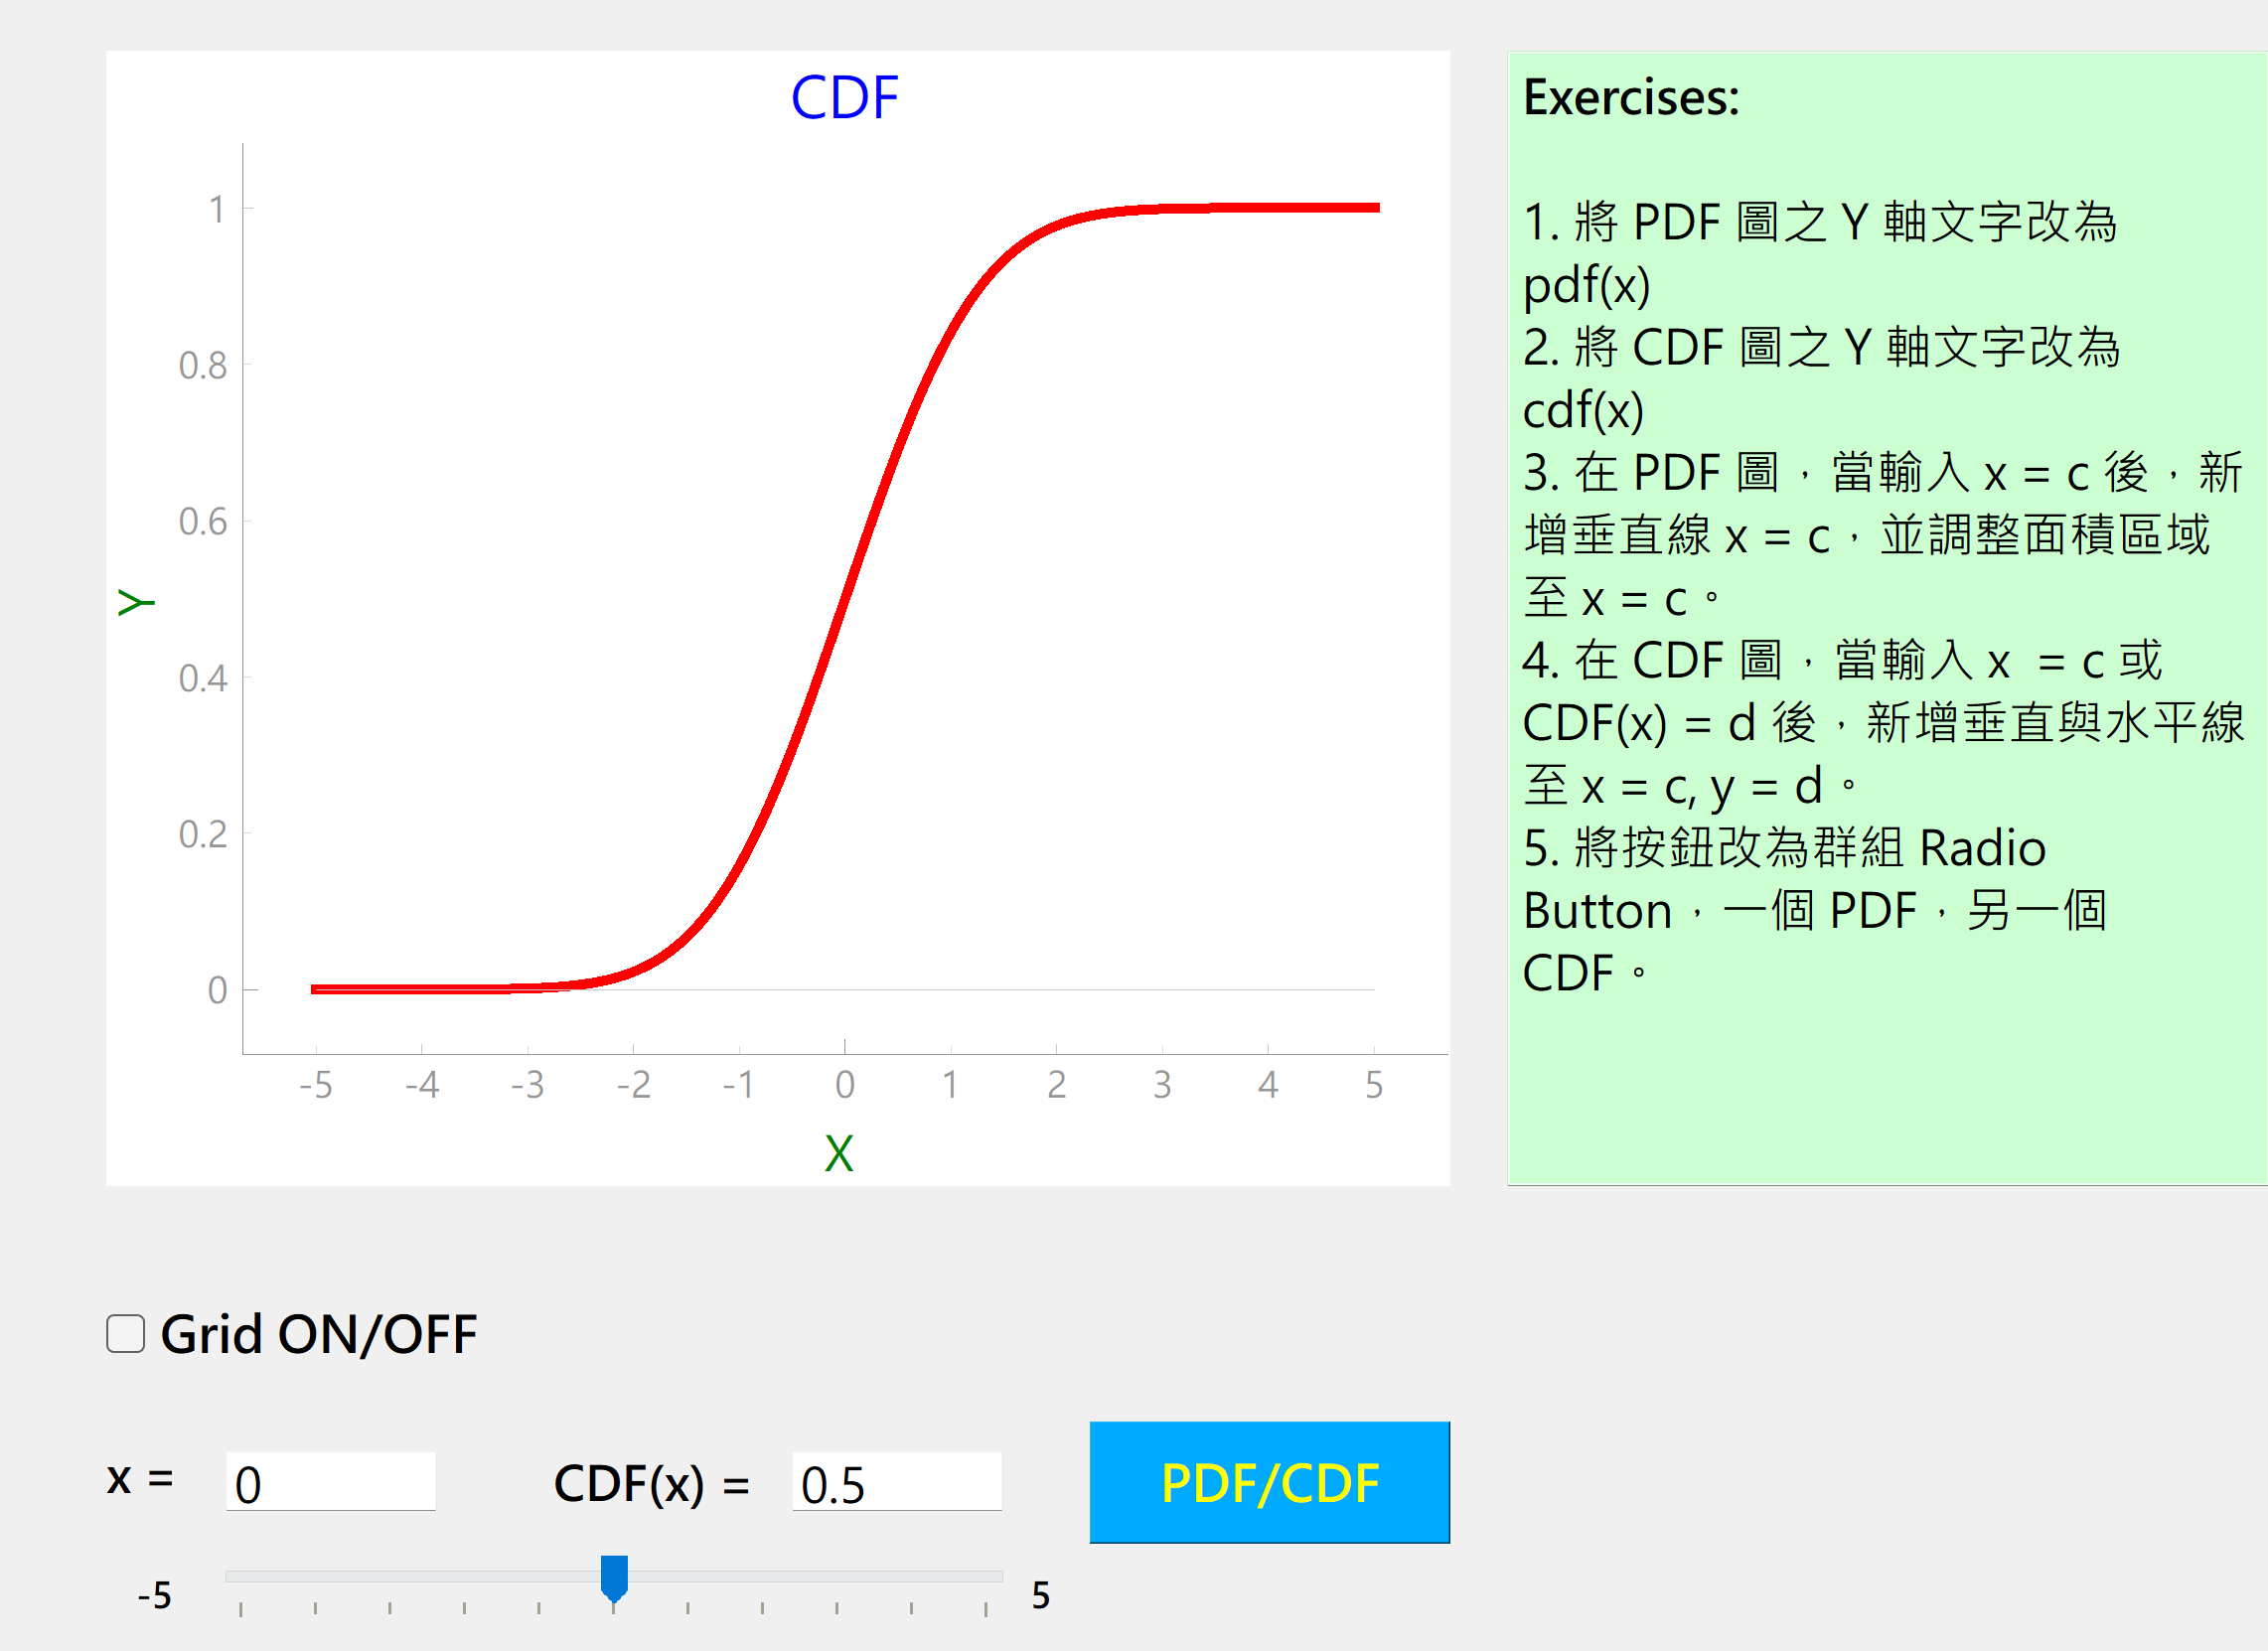
範例 1:使用 Designer 設計一個有統計元素的 GUI,其中最主要的元件是一個提供 pyqtgraph 繪圖的 widget,用來繪製標準常態分配的 PDF 與 CDF 圖。GUI 視窗如下右圖。
使用元件:checkBox, label, lineEdit, horizontal slide, pushbutton, widget
功能:
按鈕 PDF/CDF 用來轉換圖形區的圖在 PDF 與 CDF 間轉換。
輸入 x 值,即可計算累積機率值 CDF(x) 並呈現在 CDF(x) 的 lineEdit,同時帶動下方的水平拉桿到對應的位置(只能整數)。相反地,當輸入 CDF(x) 值,即可計算反函數,得到 x 值。
透過 checkBox 在圖形區加入/取消格線。
注意事項:
本範例主要介紹如何在 GUI 視窗中鑲嵌 pyqtgraph 的繪圖小視窗。前面單元介紹的 pyqtgraph,自己獨享一個視窗,但是在 GUI 的視窗中,必須委身其中,這中間的環節說來話長,總之,這也是 pyqtgraph 較 matplotlib 適合在 Qt 的應用程式中擔任繪圖的角色。要使用 matplotlib 不是不可以,但是過程曲折許多,執行效率也沒有 pyqtgraph 好,畢竟 pyqtgrapgh 是專門為 Qt GUI 設計的繪圖套件。
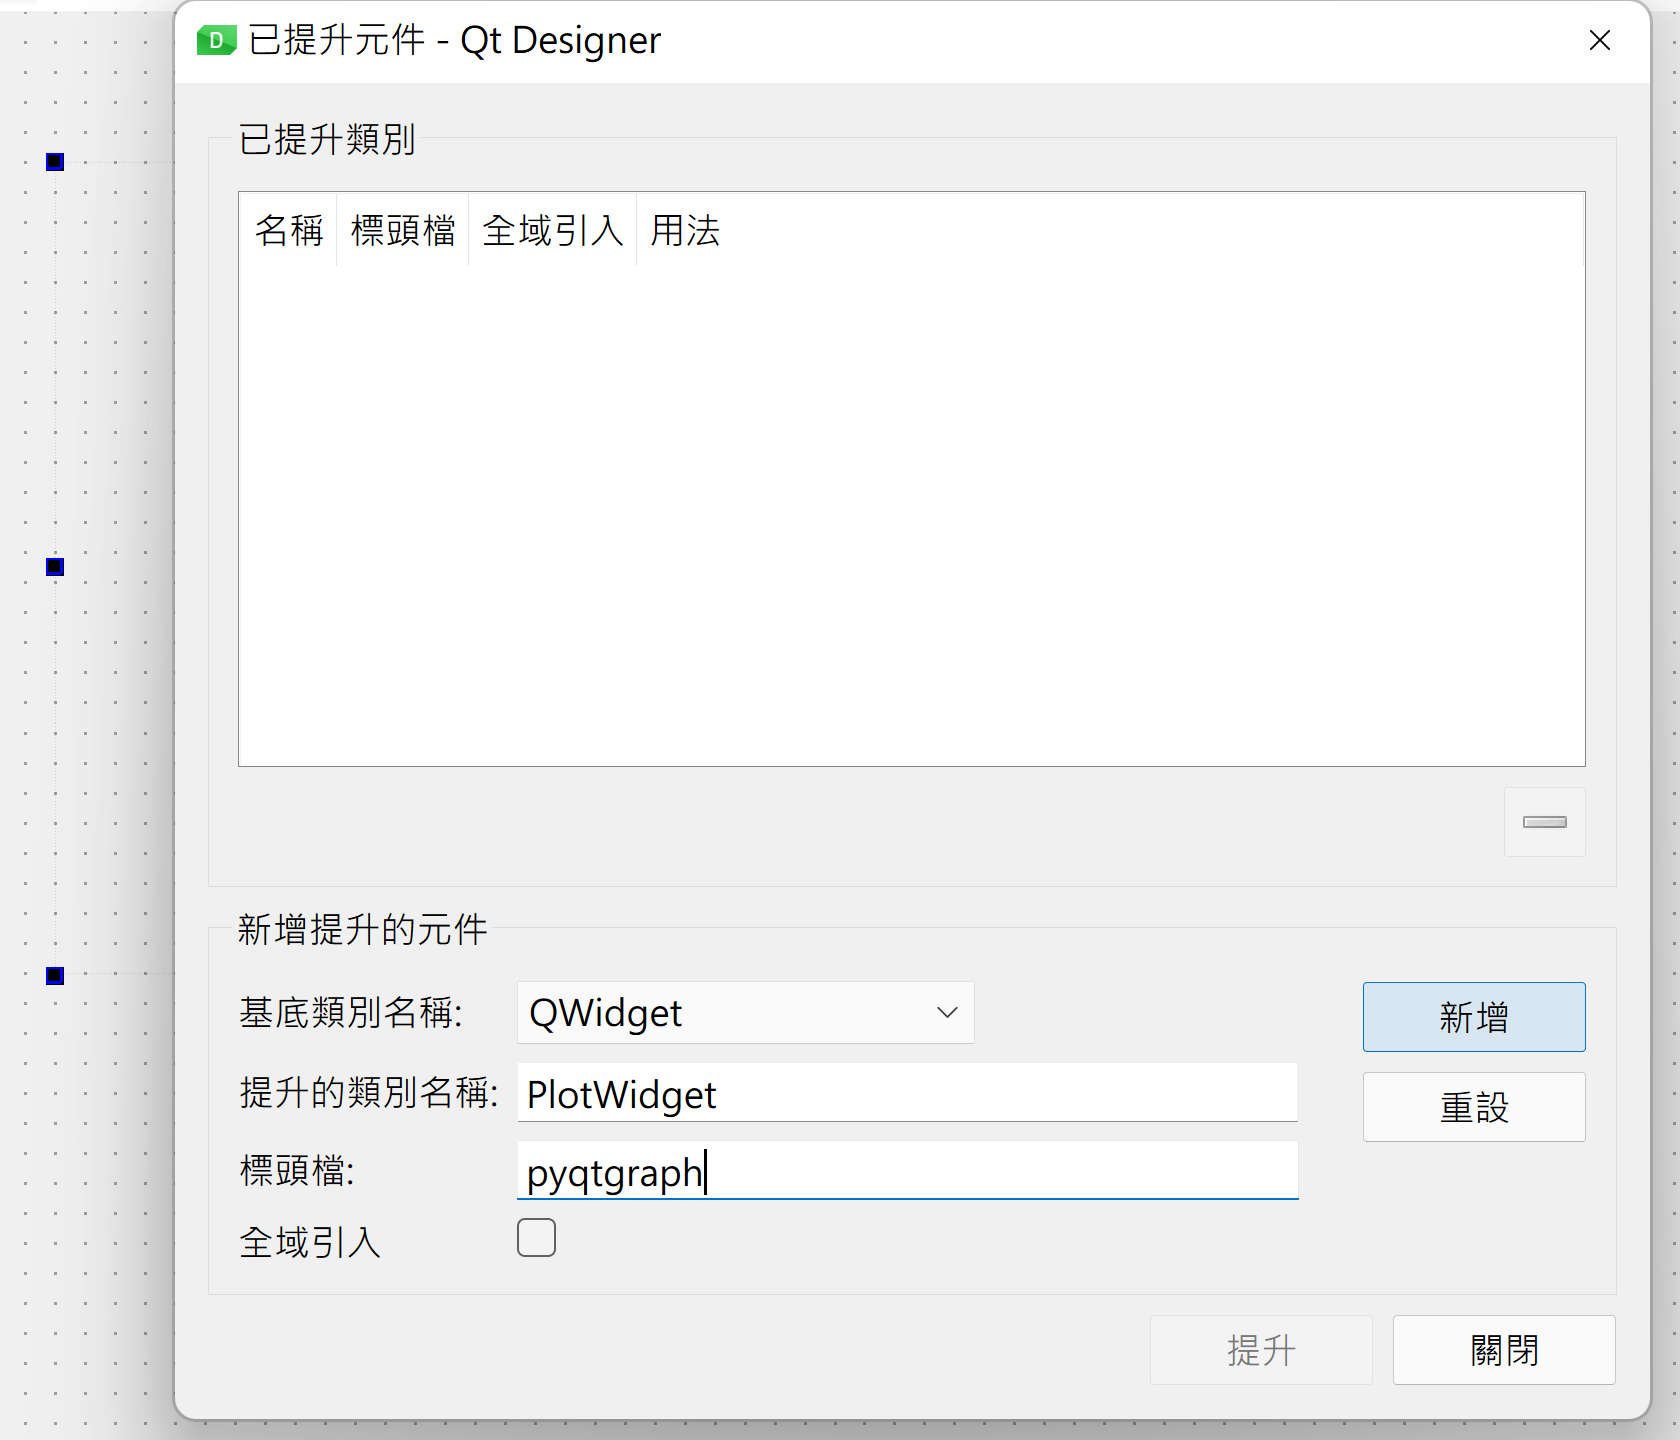
下圖的元件,除了繪製 PDF 圖的元件外,都很容易從 Designer 左邊的元件工具列找到。為了鑲嵌 pyqtgraph,可以放置 Widget 或 Graphic View 元件。拖曳到佈局中,都只是空白的方框,只需留意其大小與位置。再來必須進行一項「提升元件」的設定,以便與 pyqtgraph 結合。以下列出 pyqtgraph 官網對於提升元件所提出的步驟:(過程如下圖二所示)
- In Designer, create a QGraphicsView widget (“Graphics View” under the “Display Widgets” category).
- Right-click on the QGraphicsView and select “Promote To…”.
- Under “Promoted class name”, enter the class name you wish to use (“PlotWidget”, “GraphicsLayoutWidget”, etc).
- Under “Header file”, enter “pyqtgraph”.
- Click “Add”, then click “Promote”.
上述步驟之1,以 Graphics View 元件說明。而下圖二用了 Wdiget,兩者都可行。另,「提升的類別名稱」是 pyqtgraph 常用來繪圖的元件,如 PlotWidget 與 GraphicsLayoutWidget 都可以,後者適合分割圖形。前面單元已示範過。
另,這個為了 pyqtgraph 而準備的 widget 被提升為 PlotWidget,因此之後在程式中便是 PlotWidget 的角色(範例見前面的單元)。而這個 widget 的元件名稱也會在程式中出現,在本範例,我用了 graphWidget 為 objectName。也因此出現在下面的主程式中,即 self.graphWidget 代表在此繪圖區的繪圖物件。
雖然只是個小小的應用程式,但是牽涉到的「小工程」也不少,下列程式使用了 6 個 signals,搭配 5 個對應的 slots 函數。這些對應關係都是初學 GUI 設計必須涉獵的基本技術。仔細看看有那些對應關係及如何控制。
Qt GUI 的拉桿元件(slider)只限整數,即最小的格距為 1。這點也限制了拉桿的使用條件,用在此處(代表 x 值)並不恰當,只是示範而已。
from PyQt6 import QtWidgets, uic
import pyqtgraph as pg
import numpy as np
from scipy.stats import norm
import sys

class MainWindow(QtWidgets.QMainWindow):

    def __init__(self, *args, **kwargs):
        super(MainWindow, self).__init__(*args, **kwargs)

        #Load the UI Page by PyQt6
        uic.loadUi('PyQtGraph_Designer_1.ui', self)
        self.setWindowTitle('PyQtGraph shows normal distribution')
        self.pdfcdf_status = 1

        # Signals
        self.pdfcdf.clicked.connect(self.update_plot)
        self.checkBox_Grid.stateChanged.connect(self.gridon)
        self.lineEdit_x.returnPressed.connect(self.comp_cdf)
        self.lineEdit_cdfx.returnPressed.connect(self.comp_invcdf)
        self.hSlider_x.valueChanged.connect(self.sliderMove)
        self.hSlider_x.sliderMoved.connect(self.sliderMove)
        self.update_plot()

    # Slots
    def update_plot(self):
        self.graphWidget.clear() # clear current plot before plotting
        x = np.linspace(-5, 5, 1000)
        if self.pdfcdf_status == 1:
            y = norm.pdf(x)
            titlename = "PDF"
        else:
            y = norm.cdf(x)
            titlename = "CDF"
        pen = pg.mkPen(color=(255, 0, 0), width = 10) # Qt.DotLine, Qt.DashDotLine and Qt.DashDotDotLine

        cur1 = self.graphWidget.plot(x, y, pen = pen, name = 'Demo')
        cur2 = self.graphWidget.plot(x, np.zeros(len(y)))
        # add color patch under curve
        patchcur = pg.FillBetweenItem(curve1 = cur1, curve2 = cur2, brush = 'g')
        if self.pdfcdf_status == 1:
            self.graphWidget.addItem(patchcur)

        self.graphWidget.setBackground('w')
        self.graphWidget.setTitle(titlename, color="b", size="14pt")
        styles = {'color':'green', 'font-size':'16px'}
        self.graphWidget.setLabel('left', 'Y', **styles)
        self.graphWidget.setLabel('bottom', 'X', **styles)
        self.graphWidget.showGrid(x=False, y=False)
        self.pdfcdf_status = -self.pdfcdf_status

    def gridon(self, s):
        # print(self.checkBox_Grid.checkState())
        if s == 2: # 0 : unchecked; 2 : checked
            self.graphWidget.showGrid(x = True, y = True)
        else:
            self.graphWidget.showGrid(x = False, y = False)

    def comp_cdf(self):
        cdf = norm.cdf(float(self.lineEdit_x.displayText()))
        self.lineEdit_cdfx.setText(str(round(cdf, 4)))
        self.hSlider_x.setValue(int(float(self.lineEdit_x.displayText())))

    def comp_invcdf(self):
        x = norm.ppf(float(self.lineEdit_cdfx.displayText()))
        self.lineEdit_x.setText(str(round(x,4)))

    def sliderMove(self, x):
        self.lineEdit_x.setText(str(round(x,4)))
        self.lineEdit_cdfx.setText(str(round(norm.cdf(x), 4)))

def main():
    app = QtWidgets.QApplication(sys.argv)
    main = MainWindow()
    main.show()
    sys.exit(app.exec())

if __name__ == '__main__':
    main()

練習:依前範例第一張圖上建議的 Exercise,試著做做看。
注意事項:
模仿他人的作品,除了學到(並收藏)一些必備的技術外,還要試著變更程式或改變布局、或新增元件,或新增功能,確定自己能掌握程式的大概,以供以後參考。
最後一項,建議將按鈕的功能(在 PDF 與 CDF 間轉換)改由兩個 radio button 取代。其實,radio button 才是最適合的元件,會先使用按鈕,不外乎是沿襲之前會的元件,先將功能做出來,再來嘗試不熟悉的元件。如果做不出來,也沒關係,這只是個試驗,看看是否已經掌握 GUI 設計的梗概。後續的範例還會介紹到 radio button,特別是群組性的。
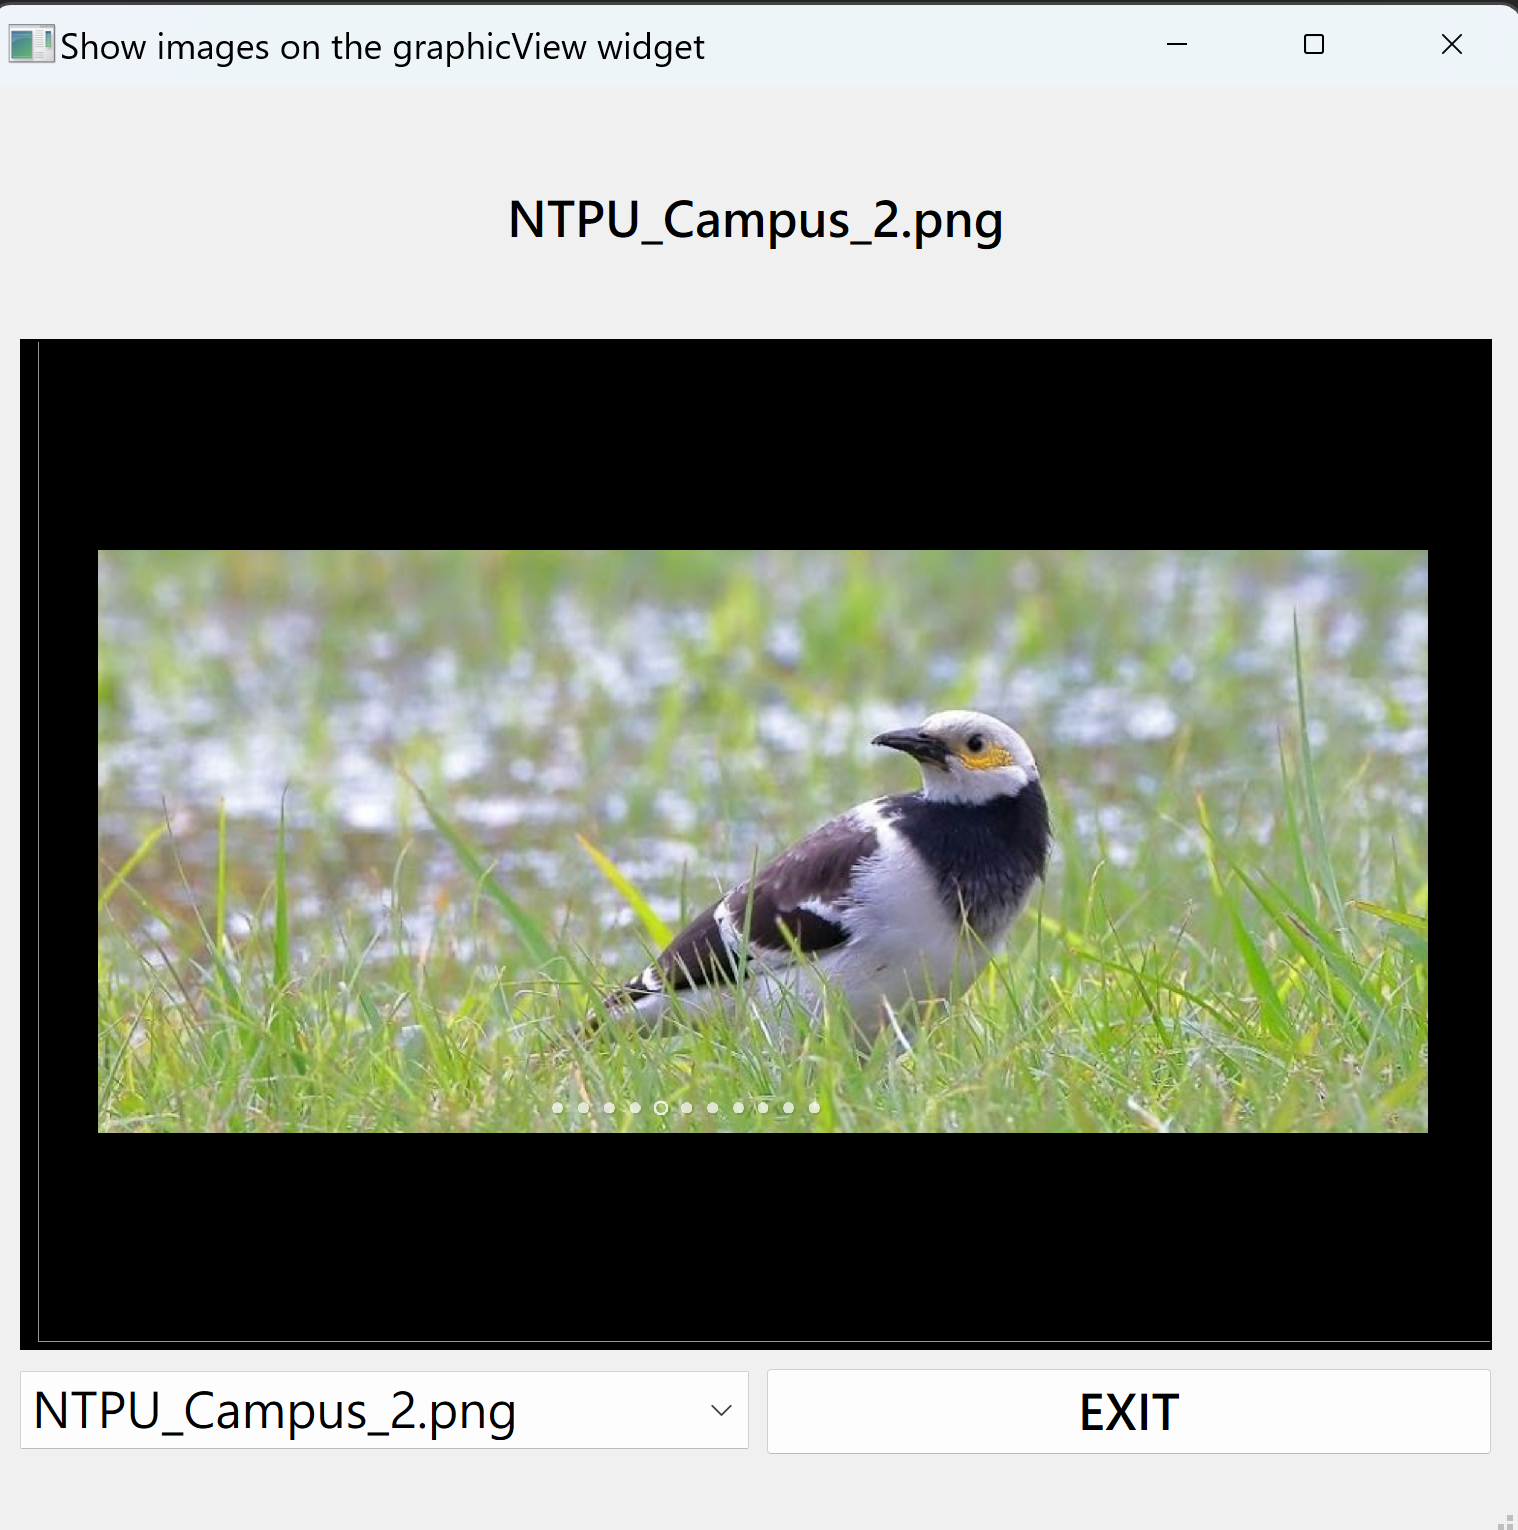
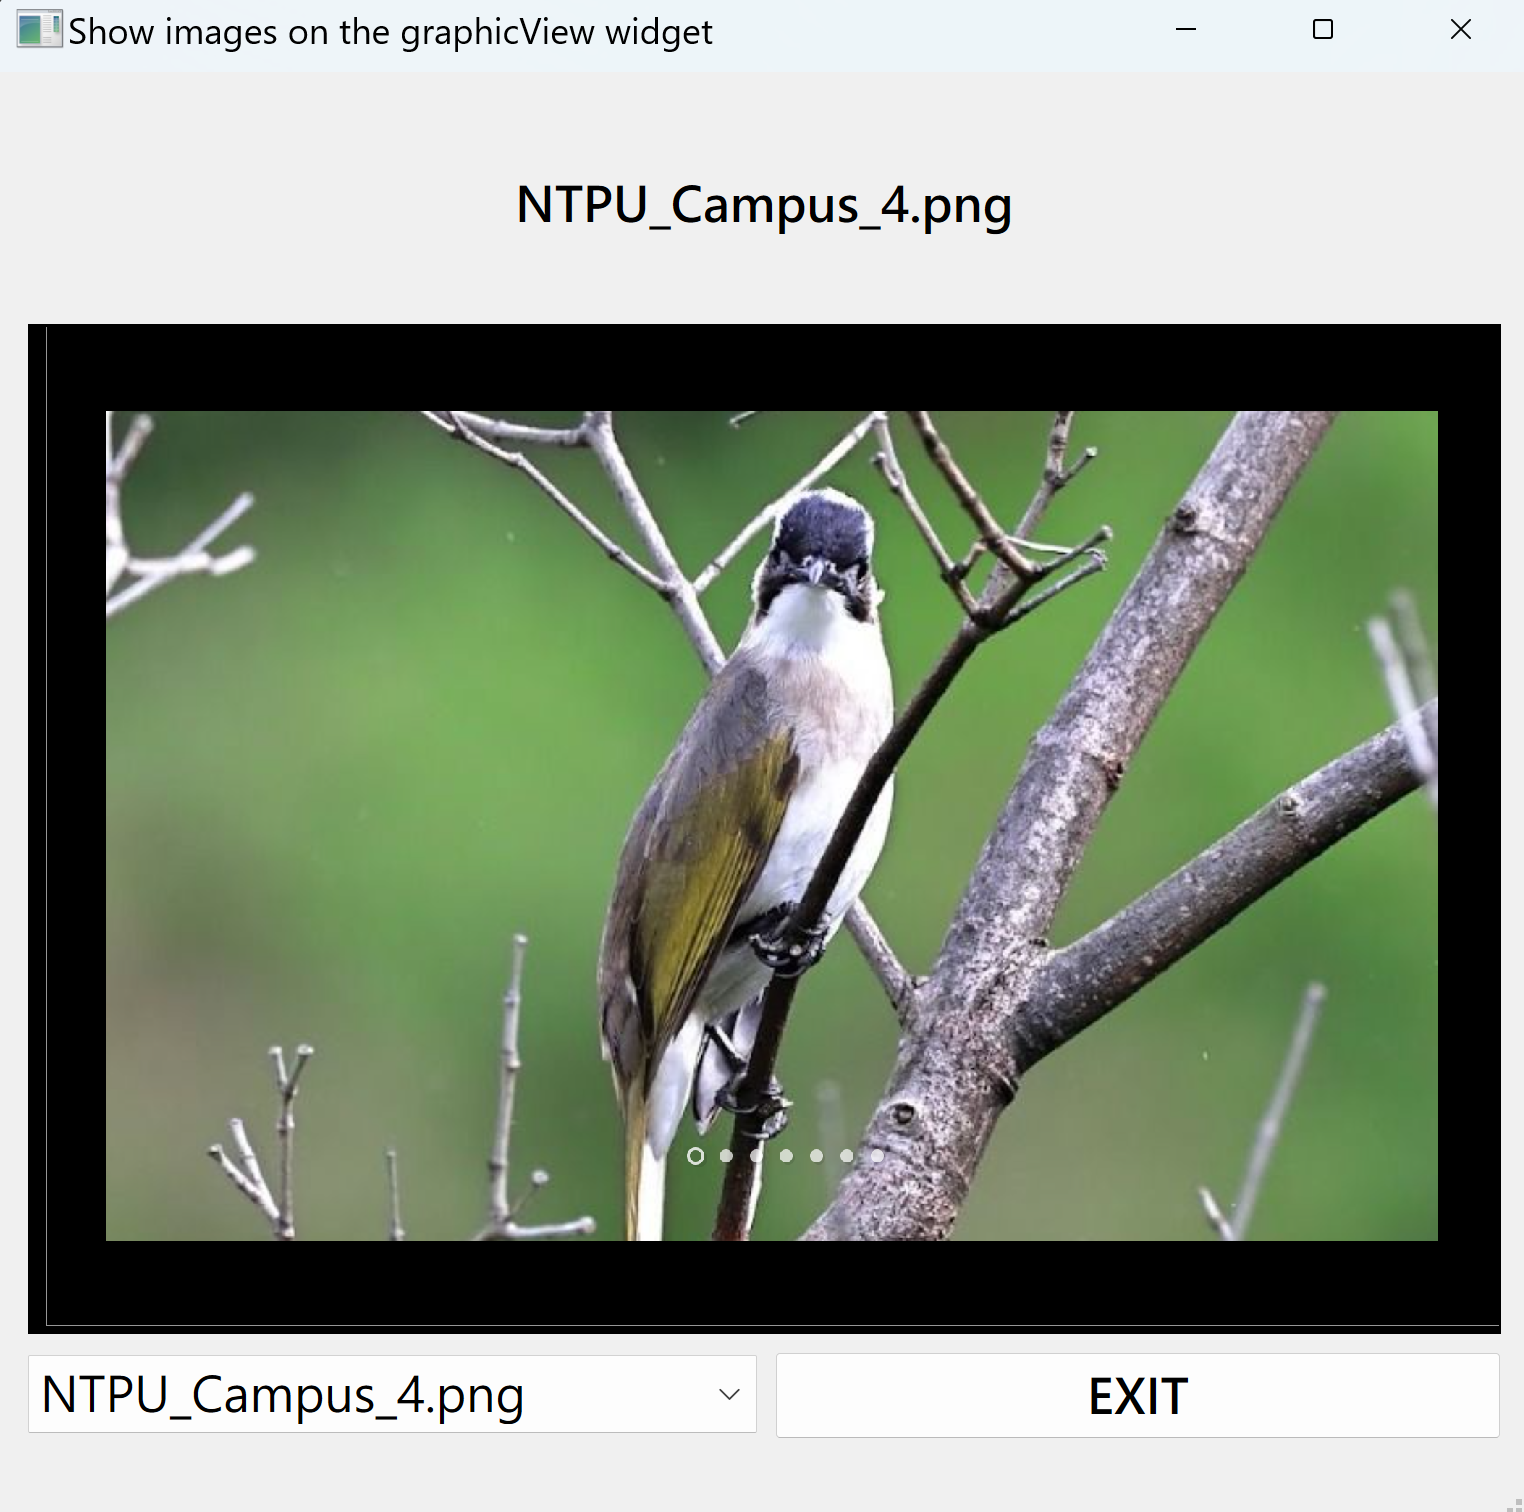
練習:前一個單元使用標籤元件(label)呈現影像的範例,當將該標籤放入佈局內,會造成影像無法被 ScaledContents,即無法等比例縮放到設定的範圍內,也造成 app 無法 resizable。不過若使用 pyqtgraph 來呈現,一切變得比較自然。下圖製作一個簡單的 app,單純地呈現影像圖也可以隨著視窗拉大或縮小跟著調整。
下載本練習的 UI 檔,觀察細節。
注意事項:
請留意 UI 檔的設計,若要使 app 能拉大縮小(resiable),除了全程的元件擺放都必須在佈局之下,連最高的 centralwidget 也必須如此。在程式右方的圖,展示在 QtDesigner 設計的「物件指示器」。從這裡可以看到從 MainWindow 以下都被佈局的層層包裹著,裡面唯一看到在繪圖的 graphWidget 這個元件左邊的佈局有個紅色圈圈。
下列程式供參考,其中影像檔放置在程式檔上一層的 images 目錄裡。直接抓取所有的檔案,並寫到 comboBox。
pyqtgraph 並沒有專門讀取影像檔的指令,於是借用 matplotlib.image 的讀檔功能。不夠不知道甚麼原因(未細查),讀進來的圖上下顛倒,於是再利用 invertY(True) 的功能調整回來。另外,也利用 setAspectLocked(lock=True, ratio=1) 的功能,在視窗拉大縮小的過程仍維持原來的比例。

from PyQt6 import QtWidgets, uic
import matplotlib.image as mpimg
import pyqtgraph as pg
import sys
import os

class MainWindow(QtWidgets.QMainWindow):

    def __init__(self, *args, **kwargs):
        super(MainWindow, self).__init__(*args, **kwargs)
        uic.loadUi('PyQtDesigner_2_plus.ui', self)
        self.setWindowTitle('Show images on the graphicView widget')

        self.file_src = "../images/"
        self.picName = os.listdir(self.file_src)
        self.comboBox_ImgName.addItems(self.picName)
        self.showImg(0)

        # Signal
        self.comboBox_ImgName.currentIndexChanged.connect(self.showImg)
        self.pBut_exit.clicked.connect(self.close)
    # Slots
    def showImg(self, s):
        self.graphWidget.clear()
        img_dir = "../images/"
        img_name = self.comboBox_ImgName.currentText()
        image = mpimg.imread(img_dir + img_name)
        img_item = pg.ImageItem(image, axisOrder='row-major')

        self.graphWidget.addItem(img_item)
        self.graphWidget.invertY(True)
        self.graphWidget.getAxis('bottom').setTicks('')
        self.graphWidget.getAxis('left').setTicks('')
        self.graphWidget.setAspectLocked(lock=True, ratio=1)

        self.label_cap.setText(img_name) # set Label text

def main():
    app = QtWidgets.QApplication(sys.argv)
    main = MainWindow()
    main.show()
    sys.exit(app.exec())

if __name__ == '__main__':
    main()

範例 2:本範例展示滑鼠的定位功能,讓程式捕捉到滑鼠的動態。另呈現群組式 radio button 的多選一功能,最後在退出視窗時,加入詢問的對話視窗,讓使用者確認是否要關閉應用程式(視窗程式的標準動作)。GUI 視窗如下右圖。
使用元件:lineEdit, group box + radio button, pushbutton, widget(promote to PlotWidget)
功能:
當滑鼠在圖形上移動時,根據所在的位置,繪製一條垂直線,一條水平線,成十字交叉。並在下方的 x = 處標示位置,並計算其累積機率呈現在 CDF(x)。
-
點選 PDF 或 CDF 改變圖形上的對應圖形。
-
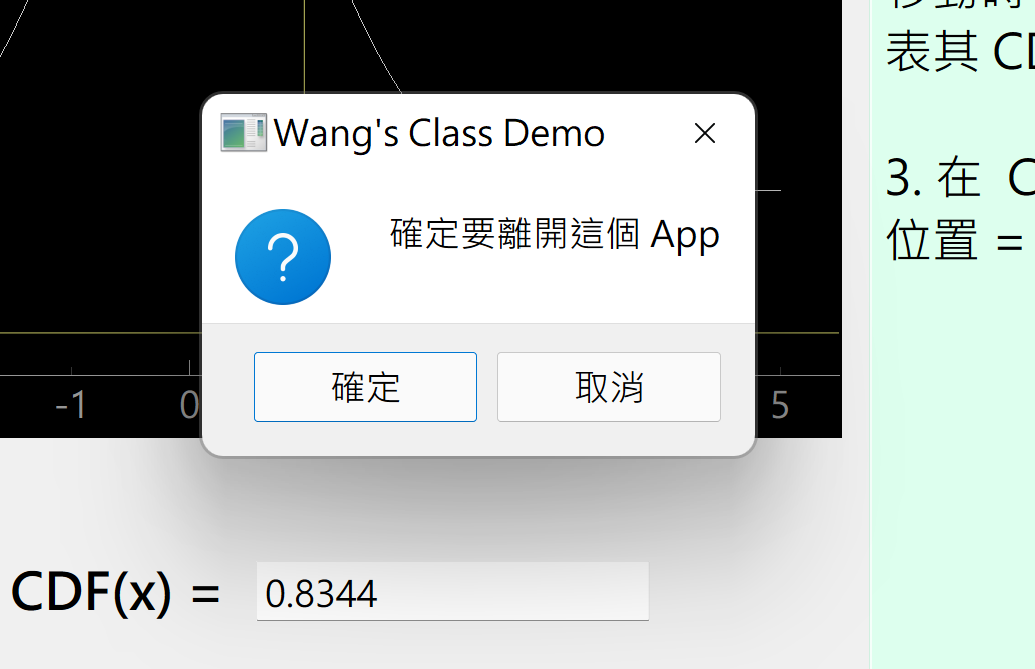
點選 EXIT 按鈕離開應用程式時,啟動對話視窗,要求使用者確認。
-
未完成功能:改變 x 值與 CDF(x) 值的 signal 與 slot 函數。譬如,改變 x 值,將計算其累積機率函數值並寫入 CDF(x) 旁的 lineEdit,同時更動畫面上的兩條水平與垂直線至適當位置。
注意事項:
本範例在 Designer 設計時,將繪圖區的 widget 元件的 objectName 命名為 gView,因此會在下面的程式碼見到 self.gView….
互動性功能是 pyqtgraph 作為天生的 Qt 繪圖套件的強項,對於滑鼠的活動,能迅速確實地捕捉,並立即做出反應。讀者可以從下列的程式碼,找到捕捉滑鼠活動的 signal,及應對的 slot 函數中如何掌握滑鼠的位置。
本範例第二個重點是「群組式的 radio button」。在 Designer 設計時,包括先加入 Group Box 元件,再拖曳兩個 radio button 進去。radio button 通常用在多選一的選項裡,利用 Group Box 協助維繫多選一(同時只能有一個 radio button 被選擇),否則會發生多個 radio button 可以同時被選擇,必須由程式本身控制。
本範例的應用程式關閉前的對話視窗,採現成的 MessageBox,只需在對應位置填妥文字並指定 icon,即可完成一個簡單的對話視窗。如下程式碼所示。當然,也可以製作專屬的對話視窗,詳細製作方式可以參考後面的單元。
from PyQt6 import QtWidgets, uic
from PyQt6.QtWidgets import QMessageBox
import pyqtgraph as pg
from scipy.stats import norm
import numpy as np
import sys

class MainWindow(QtWidgets.QMainWindow):

    def __init__(self, *args, **kwargs):
        super(MainWindow, self).__init__(*args, **kwargs)

        #Load the UI Page by PyQt6
        uic.loadUi('PyQtGraph_Designer_Mouse_1.ui', self)
        self.setWindowTitle('Mouse Move')

        self.update_plot('PDF')

        # Signales
        self.gView.scene().sigMouseMoved.connect(self.mouseMoved)
        # self.groupBox.toggled.connect(self.pdfcdf_clicked) # suitable for checkbox, not radiobutton
        self.radioBut_PDF.toggled.connect(self.pdfcdf_clicked)
        self.radioBut_cdf.toggled.connect(self.pdfcdf_clicked)
        self.pushBtn_exit.clicked.connect(self.dialogBox)

    def update_plot(self, str):
        self.gView.clear()
        x = np.linspace(-5, 5, 1000)
        if str == 'PDF':
            y = norm.pdf(x)
            title = 'Exercise : Add color patch as the mouse moves'
        else:
            y = norm.cdf(x)
            title = "Exercise : Let HLine go with the CDF value"

        self.gView.plot(x,y) # generates a PlotDataItem
        self.vLine = pg.InfiniteLine(pos = 1, angle=90, movable=False)
        self.hLine = pg.InfiniteLine(pos = 0.2, angle=0, movable=False)
        self.gView.addItem(self.vLine) # add PlotDataItem in PlotWidget
        self.gView.addItem(self.hLine)
        self.gView.setTitle(title)

    # Slots:
    def mouseMoved(self, point): # returns the coordinates in pixels with respect to the PlotWidget
        p = self.gView.plotItem.vb.mapSceneToView(point) # convert to the coordinate of the plot
        self.vLine.setPos(p.x()) # set position of the verticle line
        self.hLine.setPos(p.y()) # set position of the horizontal line
        self.lineEdit_x.setText(str(round(p.x(), 4)))
        self.lineEdit_cdf.setText(str(round(norm.cdf(p.x()), 4)))

    def pdfcdf_clicked(self):
        radioBtn = self.sender()
        if radioBtn.isChecked():
            self.update_plot(radioBtn.text())
            # print(radioBtn.text())

    def dialogBox(self):
        dlg = QMessageBox(self)
        dlg.setWindowTitle("Wang's Class Demo")
        dlg.setText("確定要離開這個 App")
        dlg.setStandardButtons(QMessageBox.StandardButton.Yes | QMessageBox.StandardButton.No)
        buttonY = dlg.button(QMessageBox.StandardButton.Yes)
        buttonY.setText('確定')
        buttonY = dlg.button(QMessageBox.StandardButton.No)
        buttonY.setText('取消')
        dlg.setIcon(QMessageBox.Icon.Question)
        button = dlg.exec()

        if button == QMessageBox.StandardButton.Yes:
            self.close()
        else:
            print("No!")

def main():
    app = QtWidgets.QApplication(sys.argv)
    main = MainWindow()
    main.show()
    sys.exit(app.exec())

if __name__ == '__main__':
    main()

練習:依前範例第一張圖上建議的 Exercise,試著做做看。
專題:練習完成一個較有規模的應用程式,如下圖所示。
功能:
這個應用程式取材於 MATLAB 的示範程式 disttool。是個完整且好用的小軟體,呈現機率分配的 PDF 與 CDF 函數,並可以依據適當範圍的參數選擇,表現每個分配所有可能的面貌。
透過滑鼠點擊圖形位置,可以計算該位置 x 值的 CDF 值,並將數字呈現在 X 軸與 Y 軸兩端。也可以輸入 x 值或 CDF(x) 值計算得到 CDF(x) 或 x 值。
使用 lineEdit 與 slider bar 控制參數的大小。同時也必須調整對方的元件內容。其中 slider bar 主要有 5 個參數要想想設定甚麼值比較恰當,分別是 minimum, maximum, single step, page step, value。試試看,這些數字分別代表甚麼意思。
這個 app 故意將 MainWindow 的背景設為黑色。請記得必須同時將文字設定為反差大顏色,譬如,白色,否則會讓像 comboBox 拉出的項目看不不清楚。
這個小軟體看似沒甚麼,其實程式裡要處裡的小事情非常多且雜,必須慢慢地、一個個處裡。一旦完成後,將得到非常多經驗與技術,對往後更大規模的應用軟體的製作有莫大助益。

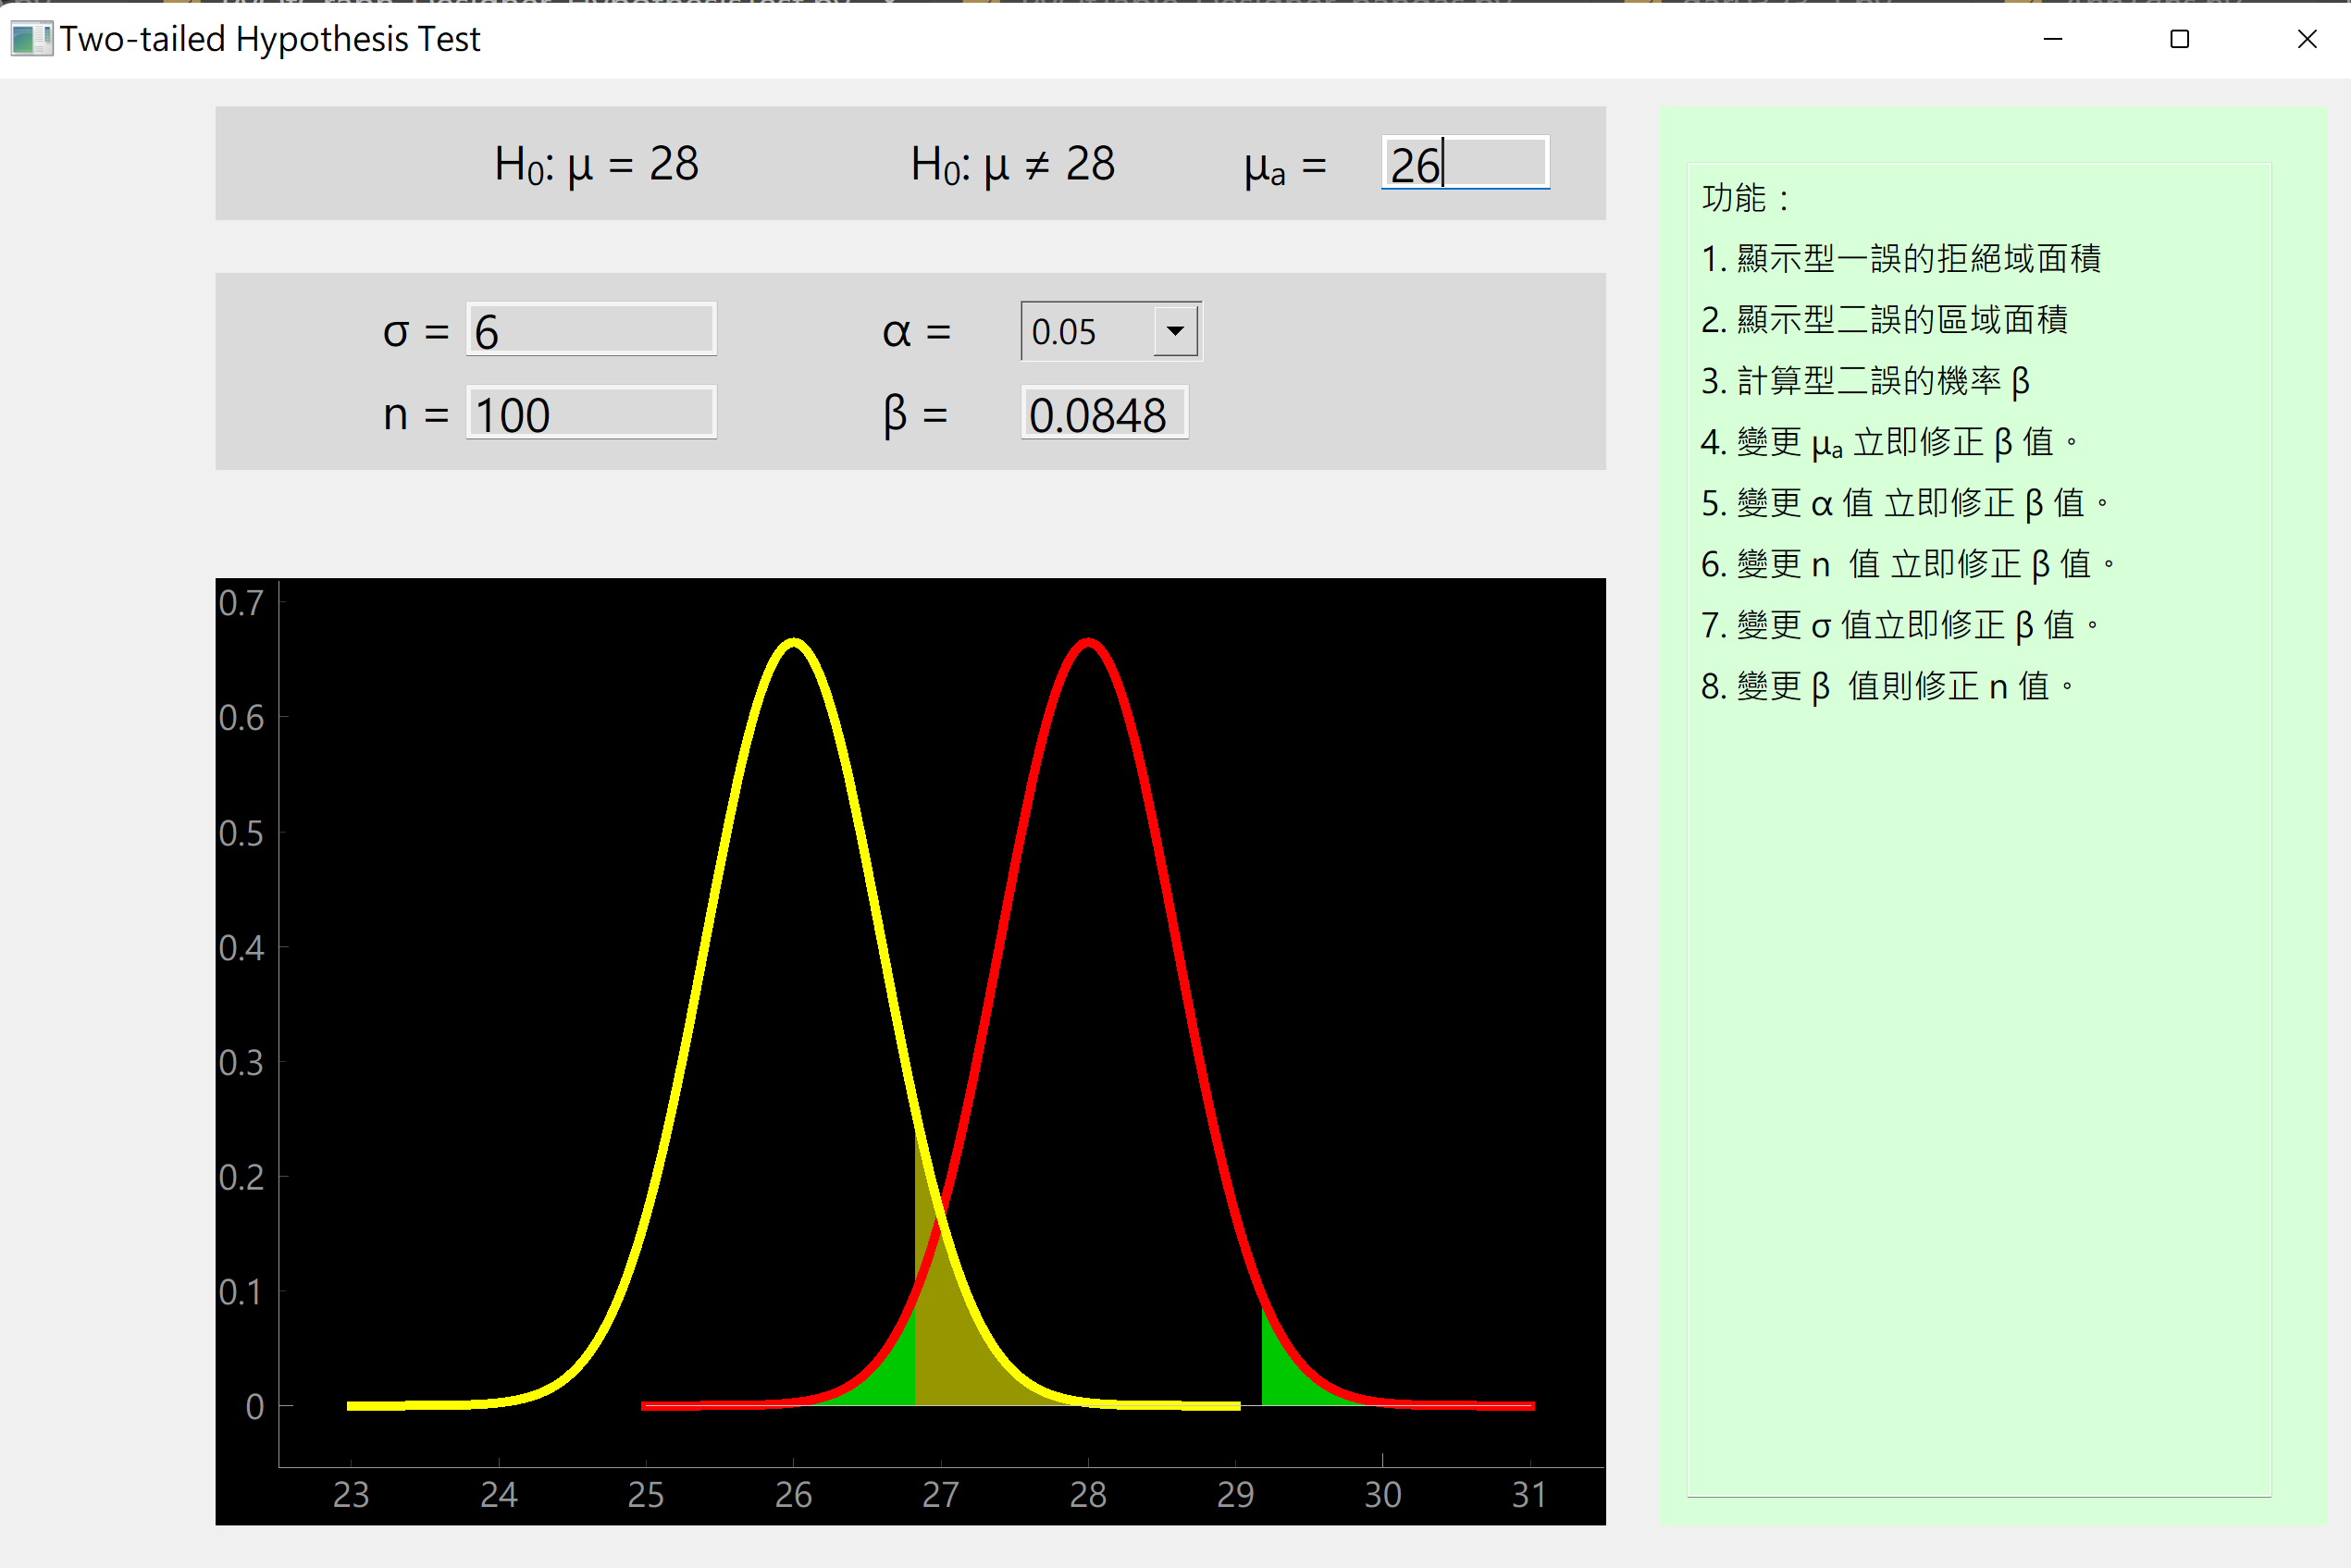
專題:練習完成一個有教學意義的應用程式,如下圖所示的雙尾假說檢定的型一誤與型二誤機率的圖示。
功能:
首先是在 GUI 上呈現數學式與符號。這是以 Rich Text 方式呈現 HTML 的語法。至於作法,可以 google 查詢,或到 https://www.keynotesupport.com/internet/special-characters-greek-letters-symbols.shtml
數學部分的 HTML 碼,也是很容易查詢,譬如下關鍵字:math in html。或參考 https://www.toptal.com/designers/htmlarrows/math/
要成功地表達述學識與符號,必須在 label 的屬性編輯器修改 textFormat 為 RichText。
這個應用程式的技術在前面的單元都已經提過,反而重點擺在假說檢定的計算,這才是統計軟體的主軸。
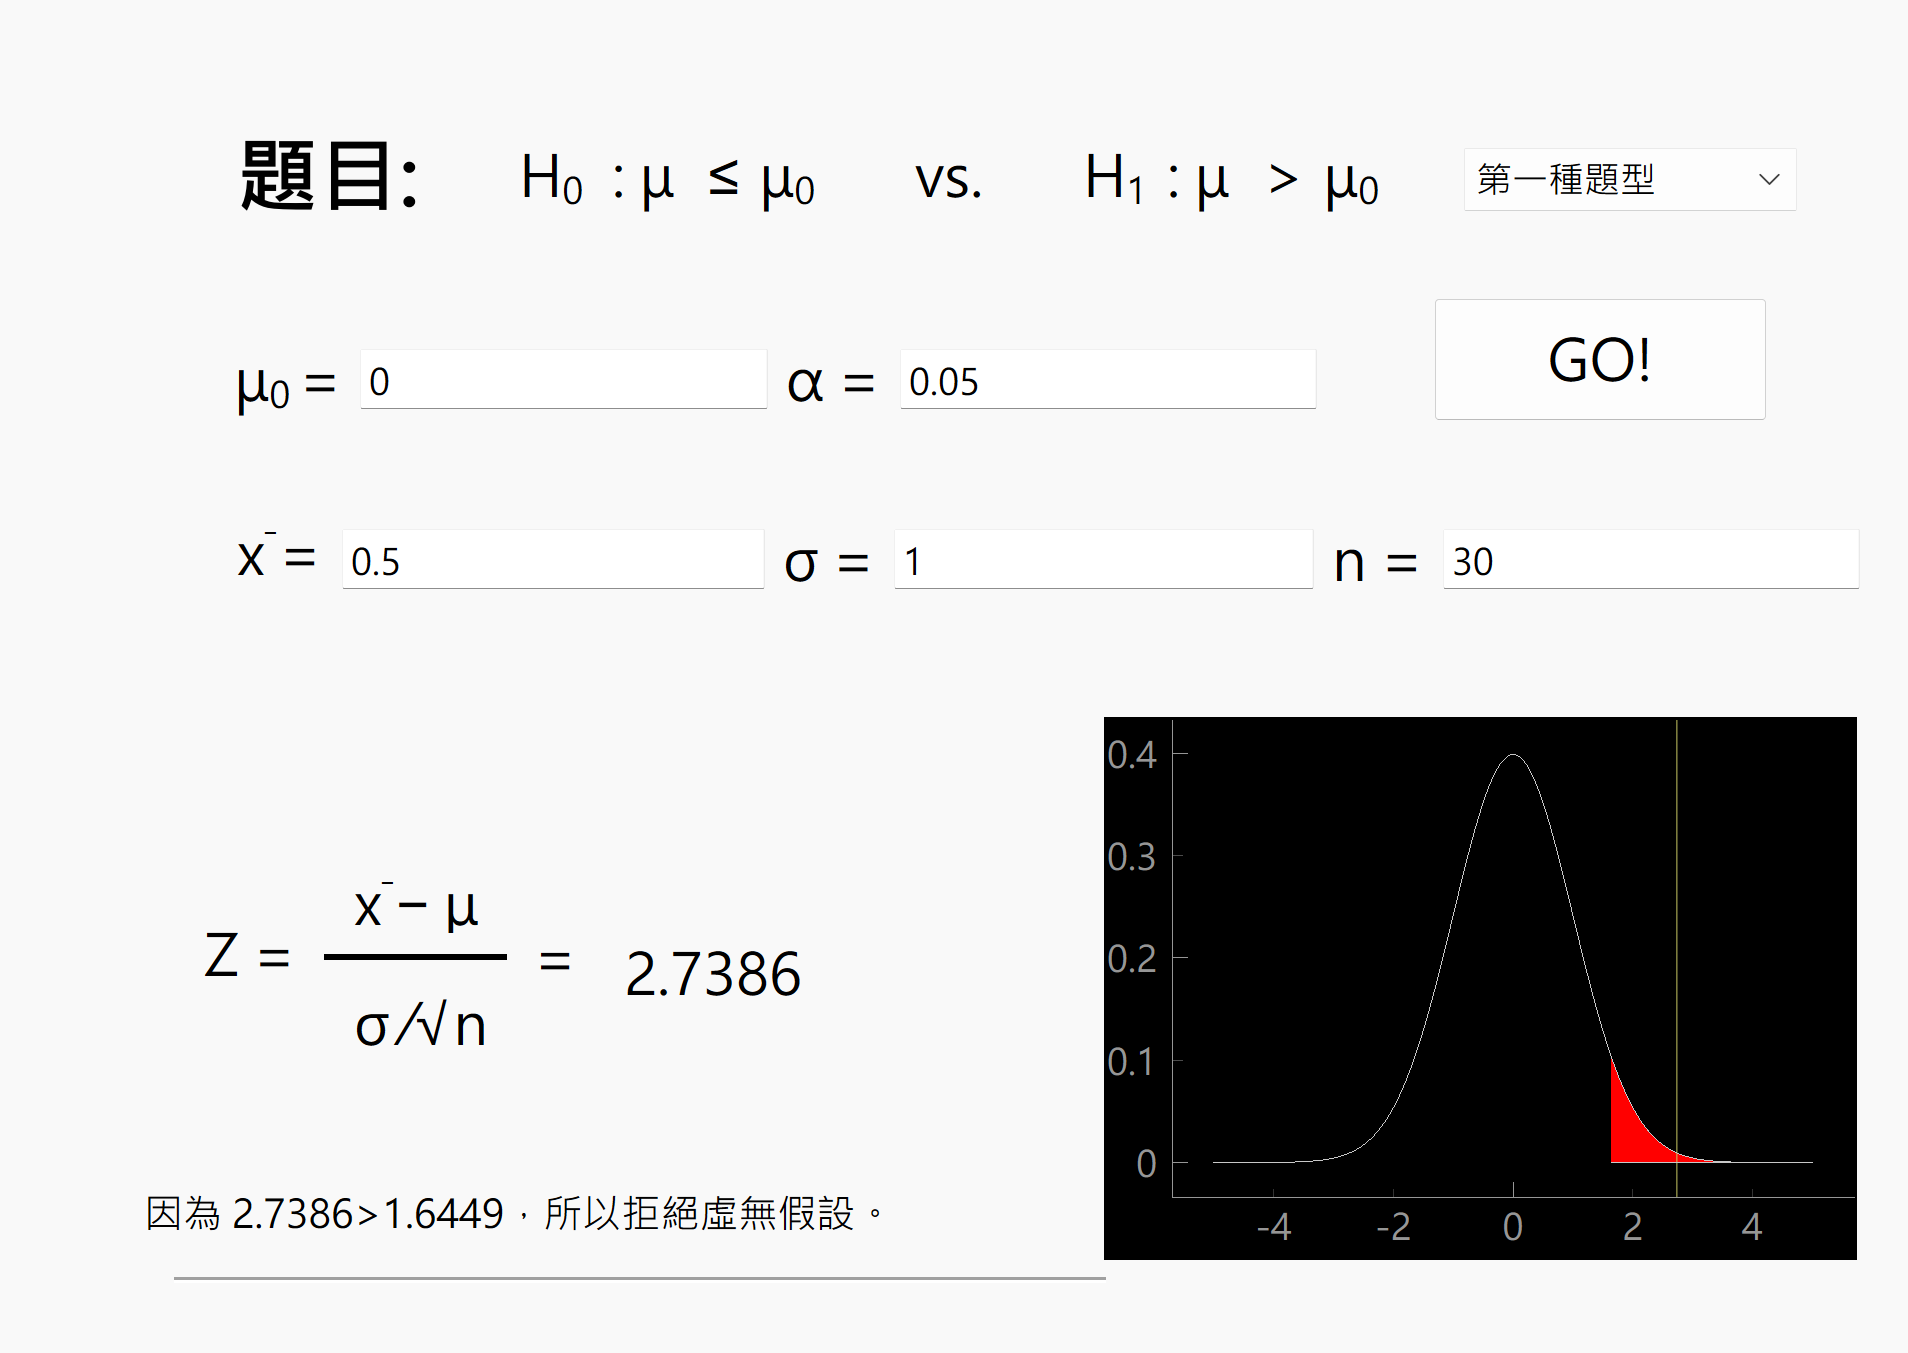
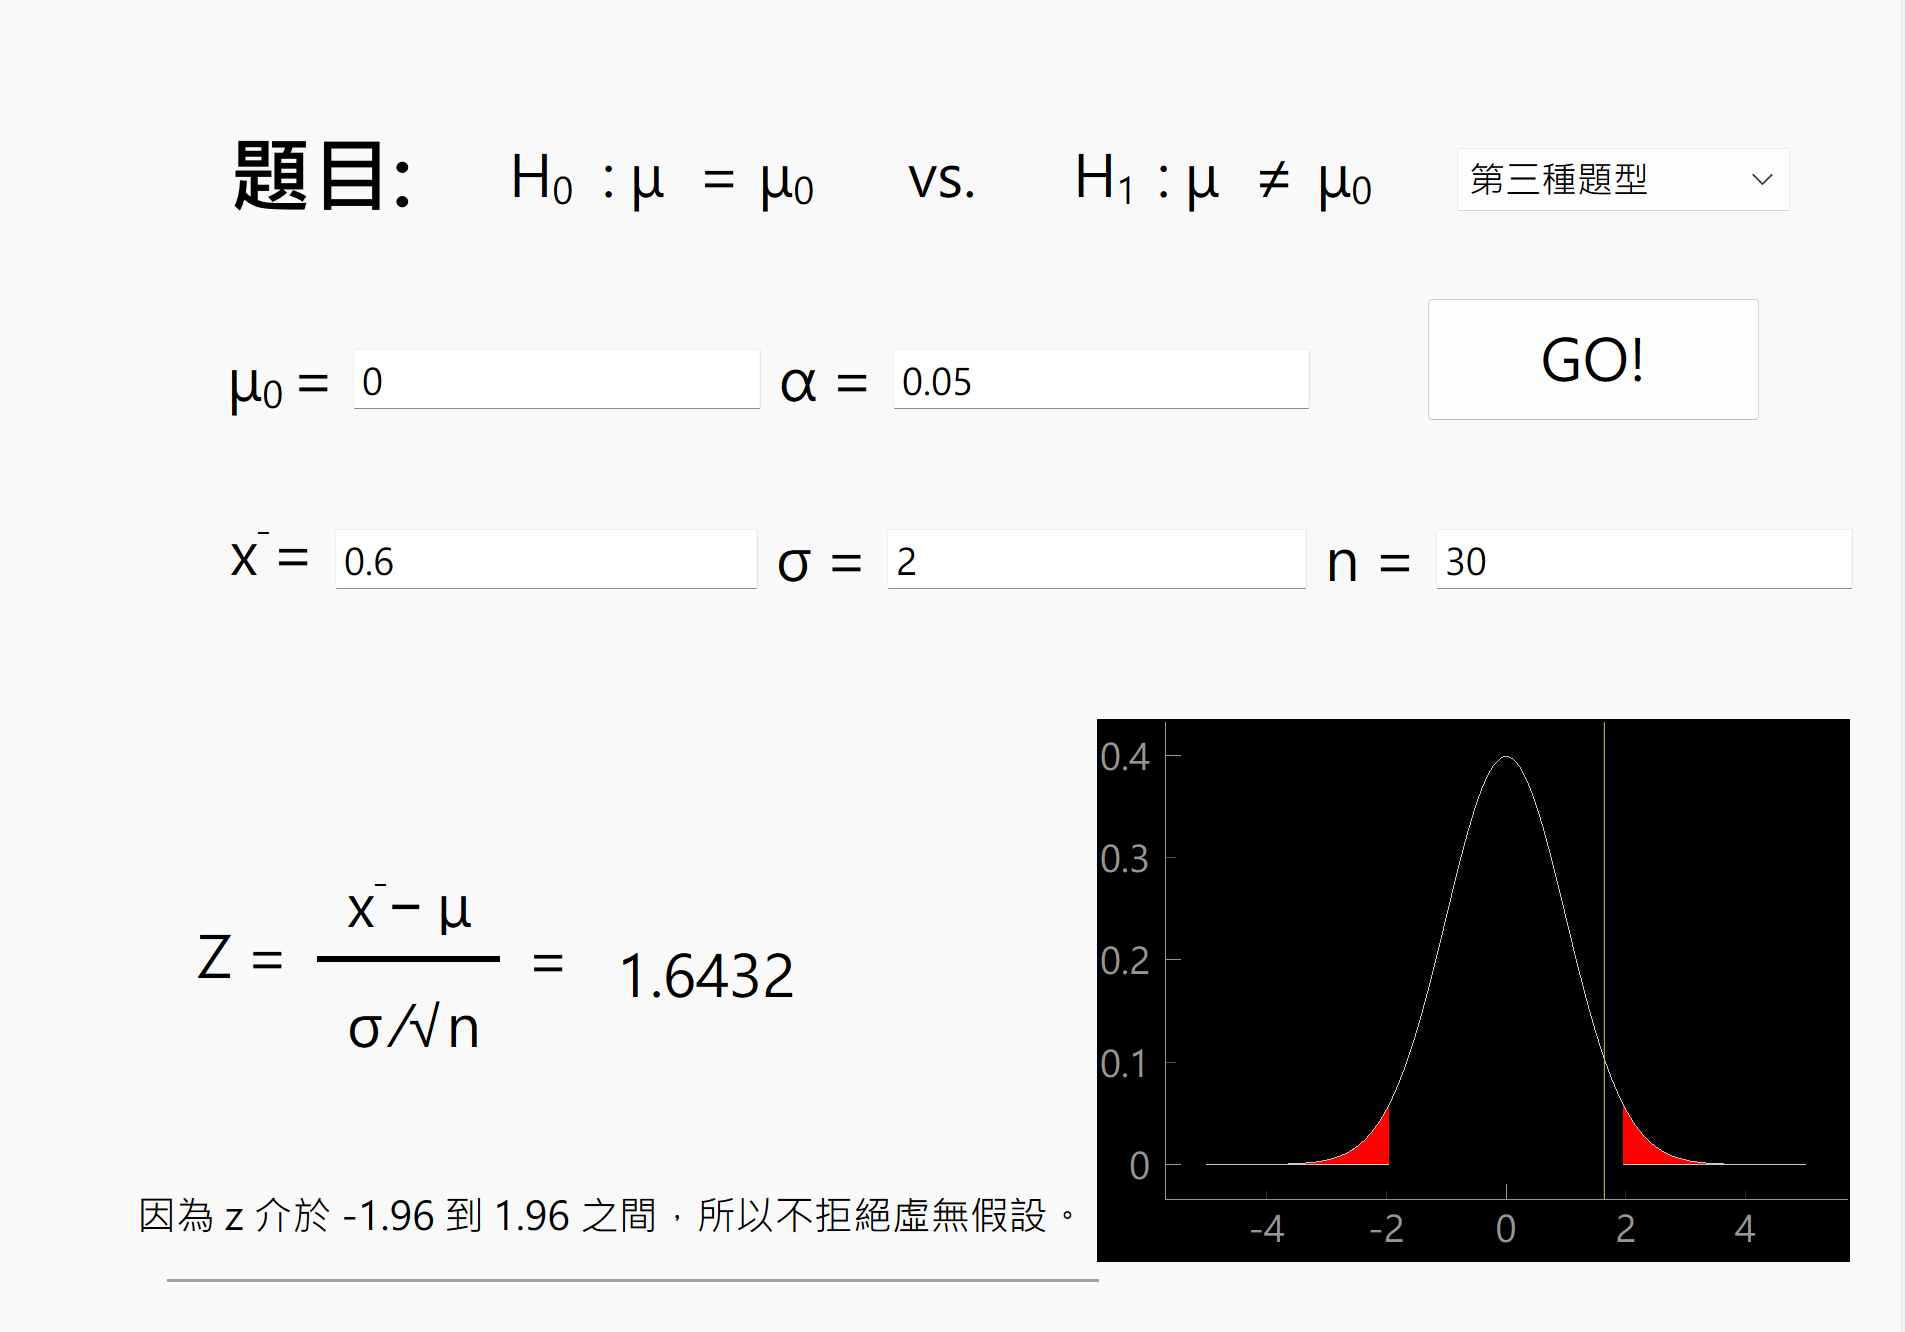
專題:練習製作如下圖所示的 Z 檢定(註)。
功能:
可以選擇 lower tail, upper tail 與 two-tail 三種檢定模式。虛無假說與對立假說也會跟著更動。
圖中的示範以統計量與臨界值的比較做決策,也可以加入 p-value。